Packers Sanitation Services Inc. : When the Warning Signs Were There All Along
04/09/2026
•
5 mins read
Forced labor is often assumed to be a problem of distant supply chains. The case of Packers Sanitation Services Inc. (PSSI) dismantles that assumption entirely.
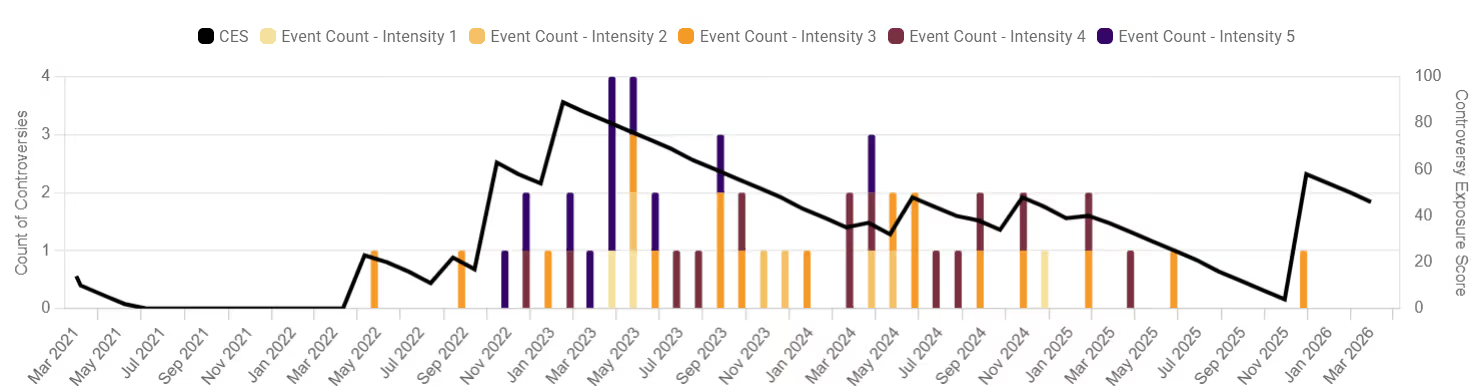
PSSI was a leading U.S. industrial cleaning contractor, servicing major meatpacking plants and backed by a top-tier private equity firm. Yet between 2022 and 2024, it became the center of one of the most significant child labor scandals in the U.S., one that had been quietly signaling its risks for years. SESAMm's controversy monitoring platform captured those early signals long before regulators intervened.
The Scandal
In November 2022, the U.S. Department of Labor discovered that PSSI had employed minors as young as 13 in hazardous overnight roles across 13 locations in 8 states. A federal investigation confirmed 102 children had been illegally employed, many handling dangerous chemicals and machinery. Three years earlier, in 2019, PSSI had already been sued for wage violations. The signal was there. It went unheeded.
The Fallout
The consequences were swift. A $1.5 million DOL fine. Contract terminations by Cargill and JBS. A DHS trafficking investigation. A replaced CEO. By late 2024, PSSI had shut its corporate office entirely. Even the private equity owner, Blackstone, faced direct scrutiny from pension funds, a reminder that labor violations travel up the ownership chain.
The Lesson
Every warning sign in this case was publicly visible before the crisis broke out. Wage lawsuits, labor complaints, and media coverage are all available in the public domain. Real-time controversy monitoring can surface these signals early, giving companies and investors the chance to act before exposure becomes unavoidable.
Forced labor is not only a humanitarian crisis. It is a material risk that demands better data, earlier detection, and stronger accountability.
Download the full case study infographic to see the complete timeline of events and key takeaways
ESG frameworks and regulations have developed due to rising awareness of sustainability and supply chain risks. They aim to enhance transparency, accountability, and ethics, encouraging environmental preservation, social improvement, and better governance. While fostering innovation and financial benefits, aligning with sustainable development goals, these measures might increase costs for businesses, especially smaller ones. Differences across regions and a focus on compliance could inhibit real change, promoting a superficial 'tick-box' approach rather than significant enhancements.
This article takes an in-depth view of some of the most relevant recent regulations and analyzes how effective they seem to be.
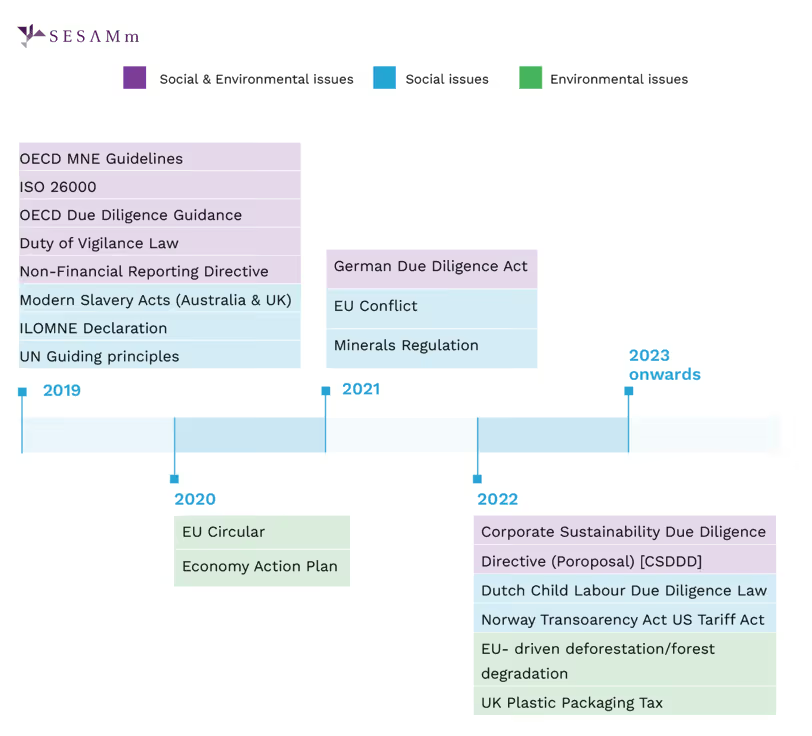
Unraveling Supply Chain Regulations: From Past to Present
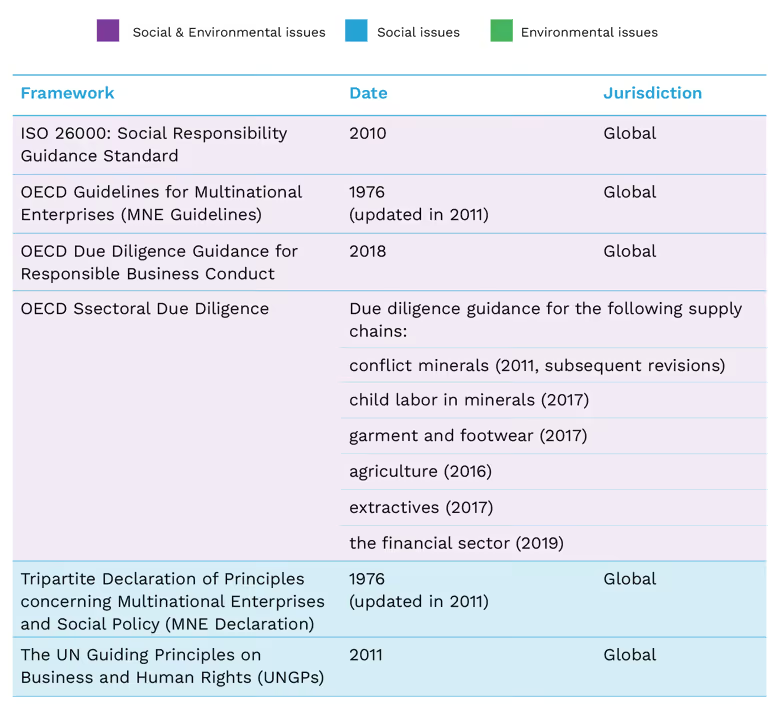
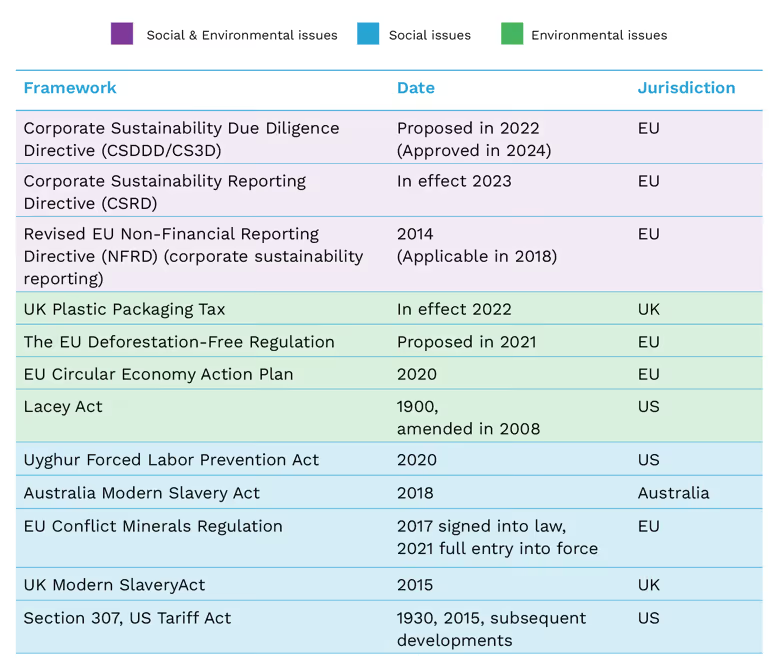
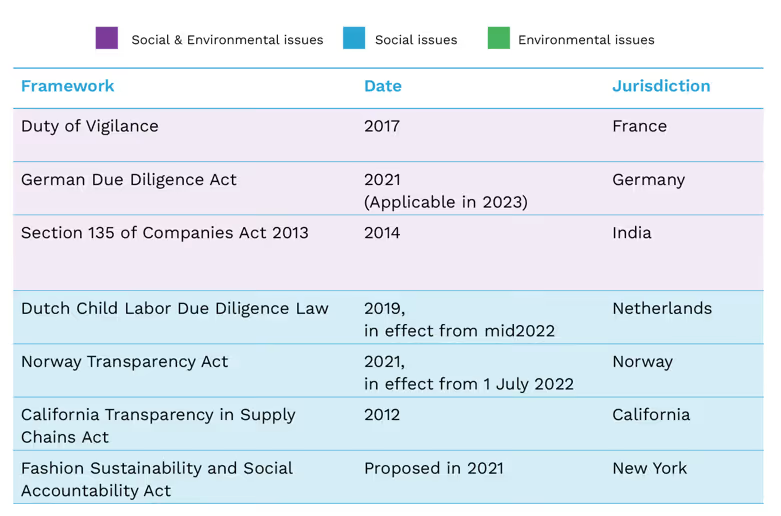
We traced the evolution of supply chain regulations from non-binding guidelines to binding laws, examining their impact on corporate sustainability. Along the way, we explored the challenges businesses face as they strive to comply with these constantly evolving standards.
Note: The list of regulations and frameworks mentioned is a high-level list of the most mentioned acts.
Global and Non-binding
When analyzing global and non-binding regulations, although they provide crucial frameworks for promoting corporate accountability by offering guidelines for responsible business conduct, they also have limitations. For instance, they lack legal enforceability due to their non-binding nature, potentially hindering compliance. Given the broad scope of the guidelines, implementation challenges arise, particularly in regions with weak governance.
Here are a few examples of recent sustainability regulations:
By Region and Binding
Binding legislation requires companies to meet specific standards in sustainability, environmental protection, and social responsibility. Non-compliance risks legal penalties and reputational damage. However, weak enforcement, insufficient penalties, and legal ambiguities often lead to criticism. Additionally, logistical and resource constraints, especially across borders, limit the effectiveness of regulatory bodies in monitoring and enforcing compliance. Furthermore, the penalties imposed are often disproportionately low. Moreover, these bodies depend on companies’ self-reporting without independent verification, leading to underreporting.
By Country/State and Binding
State or country legislation on supply chains encounters several challenges. These include jurisdictional limitations, enforcement difficulties due to resource constraints, and compliance burdens, especially for smaller businesses. Additionally, fragmented regulations across states or countries can complicate compliance for companies operating nationally. This underscores the importance of coordinated efforts between states and the federal government to address supply chain issues effectively. In addition, regulatory bodies contend with logistical and resource limitations, mainly when operating across borders, which can hinder their effectiveness in monitoring and enforcing compliance.
Unveiling Vulnerabilities Sector Screening for Supply Chain Controversies
In this section, we explore the evolving landscape of supply chain regulatory frameworks and ESG risks in supply chain management. We also dive into how future regulations will affect global trade, corporate responsibility, and sustainability efforts.
Supply Chain Controversies Over Time
We analyzed supply chain-related controversies from 2019 onwards and found a consistent increase each year, peaking in 2023. Concurrently, mentions of various frameworks, laws, and legislations [mentioned in Part I] related to these issues have also risen. Our analysis reveals a strong and positive correlation between the two trends (r=0.99), indicating a significant relationship. While the apparent increase in supply chain issues, breaches, and controversies may be concerning, it's largely caused by implementing more frameworks that increase visibility and accountability. Even without binding regulations, companies' reputations are affected. Thus, the proliferation of laws and frameworks contributes to the heightened online attention to these breaches.
Supply Chain Controversies: An ESG Analysis
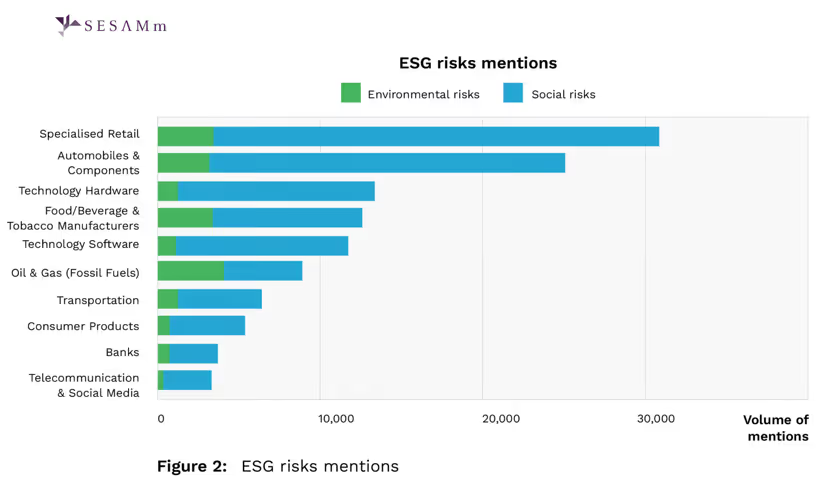
For this analysis, we primarily focused on environmental and social issues within the supply chain, as legislation often targets these areas due to their significant external impacts. Issues like environmental damage and labor violations are most likely to occur in the supply chain and can profoundly affect communities and ecosystems. Governance issues, on the other hand, are more internal and directly pertain to a company's operations and management practices. Therefore, we analyzed a sample of 31,011 entities across industries with frequent mentions of ESG-related supply chain risks, focusing on social and environmental risks.
Specialized Retail has the highest incidence of social and environmental controversies, followed by Technology Software and Automobile & Components, respectively. As shown in the graph above, many of the issues highlighted in the Social ESG supply chain pillar are driven by human and labor rights breaches, which significantly contribute to the ESG risks mentioned.
Social Risks in the Supply Chain
In specialized retail, many brands face scrutiny for alleged forced labor; some examples include Amazon, Hugo Boss, Diesel, and Costco. Additionally, Amazon garnered widespread attention when the company settled a $1.9 million human rights abuse claim. Consumer groups sued Starbucks over deceptive ethical sourcing claims linked to human rights issues. Walmart and Centric were also investigated for human rights violations. Moreover, reports tie Amazon and IKEA suppliers to forced labor. These controversies dominate ESG supply chain discussions in retail.
Regarding the other industries, we also see that technology hardware displays a significant proportion of mentions stemming from mentions of forced labor for Lenovo, Cisco, and Intel, and numerous controversies regarding Apple, among many other allegations.
Similarly, Companies from the food and beverage manufacturers industry were also linked with human rights violations and infringements on labor rights, with companies like Tyson Foods, McDonald's, Hershey, Pepsi, and Nestle having multiple supplier issues connected with child labor, discrimination, and exploitative work. While Technology Software companies mentions were primarily related to contractors and content moderators’ health & safety issues and labor rights infringements from companies like Meta, Microsoft, and Google.
In sum, the evolving supply chain regulations reflect a global commitment to sustainability and ethical business practices. Navigating these regulations presents challenges and opportunities for businesses to lead in corporate responsibility and advance principles of environmental stewardship and social equity. Embracing these regulations as a compass rather than a constraint can help chart a course toward a sustainable future.
Reach out to SESAMm
TextReveal’s web data analysis of over five million public and private companies is essential for keeping tabs on ESG investment risks. To learn more about how you can analyze web data or to request a demo, reach out to one of our representatives.
As we reflect on the year 2023, it's important to highlight the most significant ESG controversies that made headlines. Our last article in this series focused on the environmental aspect. This time, we turn our attention to the social pillar of ESG, focusing on issues such as strikes, layoffs, human rights violations, and discrimination against minority groups. We emphasize the need for accountability and action to address these pressing social issues and promote social responsibility.
Social Risks: Focus 2023
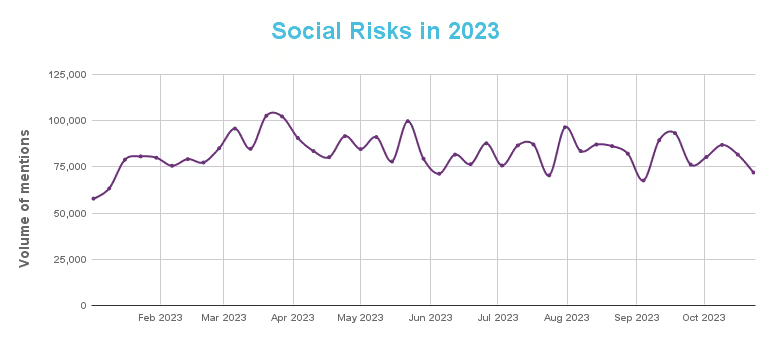
In 2023, social risks were the most significant, with layoffs and strikes gaining significant attention. It's crucial to acknowledge these social risks and take accountability and action to address them, as they underscore the urgent issues facing society.
Figure 1: Social risks in 2023.
Social Controversies of 2023
Social risks have taken the forefront in 2023, with notable web mentions increasing significantly. Here are the most relevant controversial topics:
Social Dialogue
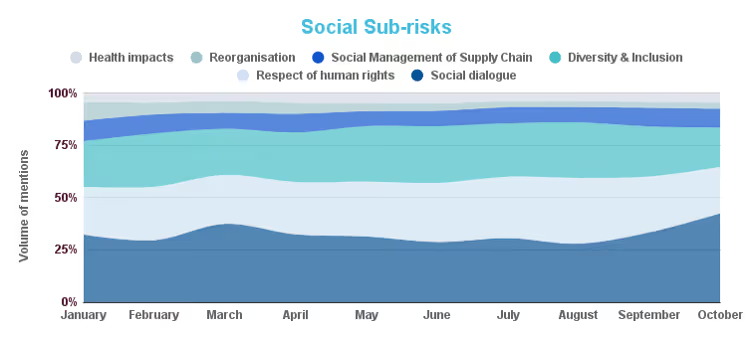
Social discourse intensified at the start of the year, with news of widespread strikes in various sectors, including aviation and education, primarily driven by pay disputes. The wave of layoffs in several tech companies was the talk of the town, especially during the first quarter of the year.
Discrimination against minority groups, including the LGBTQ community and people of color, and age-based discrimination became a significant topic of discussion in 2023.
Figure 2: Top social sub-risks in 2023.
Top 5 Social Controversies
These controversies are ranked by relative volume*.
McDonald's
Volume of mentions: 8,903
Relative volume: 87%
McDonald's faced substantial social risks in 2023 due to significant layoffs of its corporate staff in April. The move led to public concern and discussions around the company's employment practices and stability. (source)
Google
Volume of mentions: 13,504
Relative volume: 43%
Google found itself in the spotlight as it faced challenges related to major layoffs in January and October of 2023. These layoffs contributed to almost half of the social risk mentions associated with the tech giant. (source)
Meta
Volume of mentions: 10,965
Relative volume: 38%
Meta, formerly known as Facebook, also faced scrutiny as 38% of the company's social risk mentions revolved around layoffs that took place in March and October 2023. (source)
Microsoft
Volume of mentions: 6,060
Relative volume: 28%
Microsoft faced challenges due to disruptions caused by cyberattacks in early June. In addition, the company had to navigate through controversies related to layoffs, contributing to its social risks. (source)
X (formerly Twitter)
Volume of mentions: 7,246
Relative volume: 8%
X/Twitter experienced a global outage, which was followed by significant layoffs. These events led to considerable public discussions and social risks for the company. (source)
Conclusion
In summary, environmental risks remain a major concern for ESG, but the social pillar of ESG has become increasingly critical, especially in 2023. As we move forward, it's important for companies to acknowledge and address social risks, such as layoffs, strikes, human rights violations, and diversity and inclusion issues. By promoting social responsibility, companies can make a positive impact on society, create a more sustainable future, and enhance their reputation as socially responsible organizations.
Click here to learn about the top environmental and governance controversies in 2023.
Relative volume*: Relative to the total volume of E, S, or G risks for the company during the same period.
SESAMm’s AI Technology Reveals ESG Insights
Discover unparalleled insights into ESG controversies, risks, and opportunities across industries. Learn more about how SESAMm can help you analyze millions of private and public companies using AI-powered text analysis tools.
Effectively managing environmental, social, and governance (ESG) risks is important, especially for private equity firms focusing on small or private companies. These firms often lack the detailed public data available for larger corporations, making it challenging to identify hidden ESG controversies that could impact investments. Traditional methods, heavily reliant on structured data and formal disclosures, often fall short when dealing with unstructured and fragmented information found in diverse sources like social media, local news, and niche industry reports. This is where Artificial Intelligence (AI) comes into play.
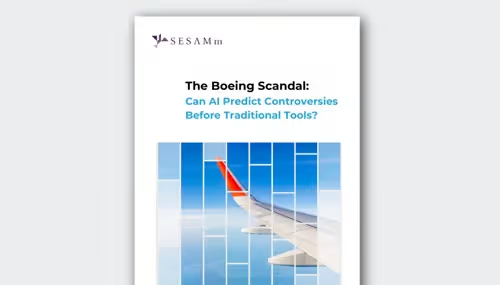
Our ebook, "The Boeing Scandal: Can AI Predict Controversies Before Traditional Tools?," explores the transformative role AI can play in enhancing ESG risk assessment processes. It explores the limitations of conventional methods and demonstrates how AI technologies, such as natural language processing (NLP) and machine learning, offer a more effective solution for identifying ESG risks. By analyzing vast amounts of unstructured data from various sources, AI gives firms access to the early detection of potential controversies, providing a more comprehensive and proactive approach to risk management.
A key highlight of the ebook is a detailed case study on Boeing, a major player in the aerospace industry. Through AI-driven analysis, we identified early signs of emerging controversies surrounding Boeing's safety practices and governance issues. The case study illustrates how AI can sift through complex data, uncover hidden patterns, and provide early warnings that allow stakeholders to act before these issues escalate into major crises.
The ebook outlines a step-by-step AI-driven process for ESG risk detection, from data collection and filtering to advanced sentiment analysis and actionable insights. This comprehensive guide empowers private equity firms to move beyond reactive strategies and adopt a proactive stance in ESG risk management.
Reach out to SESAMm
TextReveal’s web data analysis of over five million public and private companies is essential for keeping tabs on ESG investment risks. To learn more about how you can analyze web data or to request a demo, reach out to one of our representatives.
Stay ahead with the latest in ESG and AI intelligence
Join our mailing list to receive new reports, event invites, and updates from SESAMm directly to your inbox.







.png)