SESAMm Launches Controversy Exposure Score: A New Era for ESG Risk Analysis
September 12, 2024
•
5 mins read
We are excited to announce the launch of SESAMm’s proprietary Controversy Exposure Score (CES), a new score designed to transform how ESG and finance professionals assess risks. The CES offers a dynamic, real-time view of a company's exposure to ESG controversies, enabling fast, informed decision-making.
What is the Controversy Exposure Score (CES)?
The CES is a continuously updated score ranging from 1 to 100, reflecting a company or project's evolving exposure to ESG controversies. Leveraging SESAMm’s proprietary Intensity and Volume Scores, the CES captures both the severity and frequency of ESG incidents, allowing stakeholders to monitor and understand risks as they develop. Below, we’ve put together an example demonstrating how the CES for Renault compares to Stellantis based on their respective ESG controversies. As we see in the chart below, Renault has had fewer high–intensity events, which results in a lower, more stable CES compared to Stellantis.
Renault CES
Stellantis CES
How Does It Work?
The CES is powered by state-of-the-art Large Language Models (LLMs) that filter and analyze content from our data lake containing over 25 billion articles. Two main components impact the score’s value:
Intensity Score: Measures the severity of each ESG incident, considering its impact on a company’s reputational, stakeholder, financial, and legal standing. This score is derived from a Large Language Model (LLM) fine-tuned by SESAMm’s experts and trained on thousands of humanly annotated events.
Volume Score: Assesses the number of articles associated with an event, calculated using a short-term rolling window. To ensure accuracy, the Volume Score is normalized against the average article volume concerning the company and relevant ESG topics over the past year, reducing potential bias.
Track ESG controversy trends: Evaluate how a company’s risk exposure has evolved. The CES is updated daily, ensuring that users have the most current data at their fingertips.
Benchmark companies against their peers: Compare a company’s risk exposure to its peers, providing a comprehensive view of its relative risk.
Ready to Transform Your ESG Analysis?
For more information on how the Controversy Exposure Score can help you make smarter, data-driven decisions and to see it in action, request a demo.
Reach out to SESAMm
TextReveal’s web data analysis of over five million public and private companies is essential for keeping tabs on ESG investment risks. To learn more about how you can analyze web data or to request a demo, reach out to one of our representatives.
Private markets are changing fast. From new ESG regulations to advances in AI, the forces shaping investment decisions are multiplying.
Join Clarity AI and SESAMm as we explore the biggest shifts redefining private-market investing in 2026 and how data and technology are transforming due diligence, risk management, and deal flow.
Watch this replay to explore:
What shaped private markets in 2025 - and what’s ahead in 2026
How AI is transforming due diligence, risk monitoring, and value creation
What these changes mean for deal-flow, risk, and competitive advantage
Financial and ESG insights begin with big data coupled with data science.
At SESAMm, our artificial intelligence (AI) and natural language processing (NLP) platform analyzes text in billions of web-based articles and messages. It generates investment insights and ESG analysis used in systematic trading, fundamental research, risk management, and sustainability analysis.
This technology enables a more quantitative approach to leveraging the value of web data that is less prone to human bias. It addresses a growing need in public and private investment sectors for robust, timely, and granular sentiment and environment, social, and governance (ESG) data. This article will outline how the data is derived and illustrate its effectiveness and predictive value.
Content coverage and ESG data collection
The genesis of SESAMm’s process is the high-quality content that comprises its data lake, the source from which it draws its insights. SESAMm scans over four million data sources rigorously selected and curated to maximize coverage of both public and private companies. Three guiding criteria—quality, quantity, and frequency—ensure a consistently high input value.
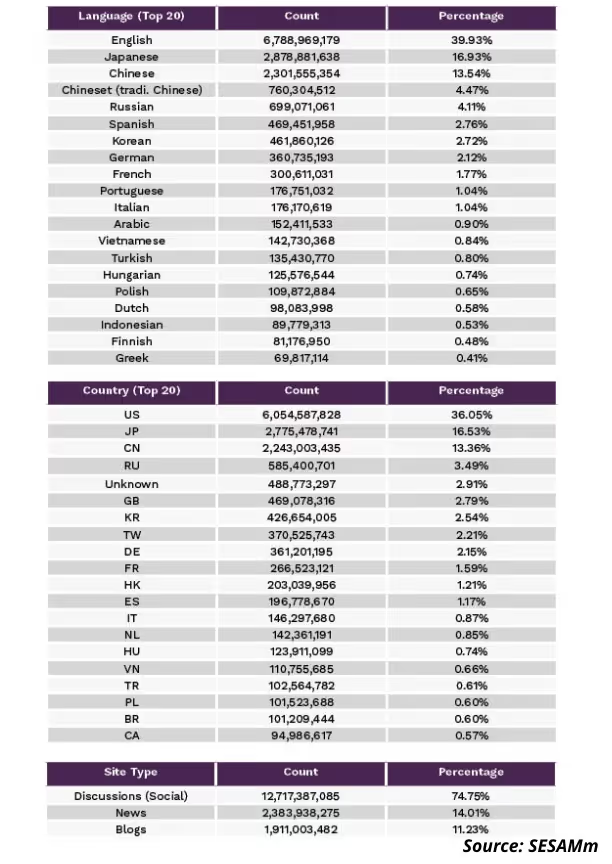
Every day the system adds millions of articles to the 16 billion already in the data lake, going back to 2008. The coverage is global, with 40% of the sources in English (the U.S. and international) and 60% in multiple languages. The data lake, expanding every month, comprises over 4 million sources, including professional news sites, blogs, social media, and discussion forums.
The following tables illustrate SESAMm’s data lake distribution (Q1 2022):
Respect for personal privacy figures highly in the data gathering process. We don’t capture personal data, like personally identifiable information (PII), and respect all website terms of service and global data handling and privacy laws. SESAMm’s data also doesn’t contain any material non-public information (MNPI).
Deriving financial signals and ESG performance indicators
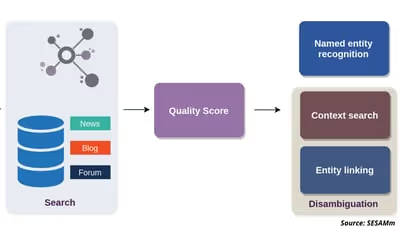
SESAMm’s new TextReveal® Streams platform applies NLP and AI expertise to process the premium quality content gathered in its data lake. This complex process involves named entity recognition (NER) and disambiguation (NED)—the process of identifying entities and distinguishing like-named entities using contextual analysis—and mapping the complex interrelationships between tens of thousands of public and private entities, connecting companies, products, and brands by supply chain, location, or competitive relationship.
Process representation for NER and NED
Using SESAMm’s TextReveal Streams, this wealth of information is filtered to focus on four crucial contexts for systematic data processing, risk management, and alpha discovery:
Sentiment covering major global indices: world equities (and Small Caps, Emerging), U.S. 3000, Europe 600, KOSPI 50, Japan 500, Japan 225
Sentiment covering all assets and derivatives traded on the Euronext exchange
Private company sentiment on more than 25,000 private companies
ESG risks covering 90 major environmental, social, and governance risk categories for the entire company universe, which includes more than 10,000 public and more than 25,000 private companies with worldwide coverage
TextReveal Streams data sets and assessments are used by financial institutions, rating agencies, and the financial services sector, such as hedge funds (quantitative and fundamental) and asset managers, to optimize trade timing and identify new sustainable investment opportunities. Private equity deal and credit teams also use the data for deal sourcing and due diligence. Private equity ESG teams use it to manage initiatives like portfolio company environmental, social, and governance risk and reporting.
Methodology and technology for processing unstructured data
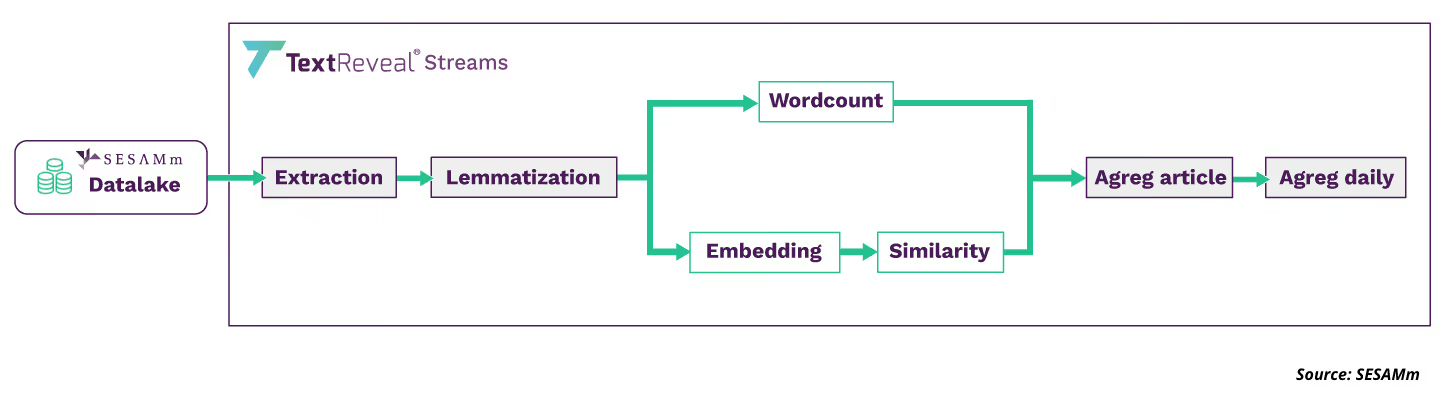
NLP workflow, from data extraction to granular insight aggregation
Data is continually extracted from an expanding universe of over four million sources daily. As it enters the system, it is time-stamped, tagged, indexed, and stored in our data lake to update a point-in-time history extending from 2008 to the present. The source material is then transformed from raw, unstructured text data into conformed, interconnected, machine-readable data with a precise topic.
NLP workflow for TextReveal Streams
Mapping relationships between entities with the Knowledge Graph
At the heart of the text analytics process is SESAMm’s proprietary Knowledge Graph, a vast map connecting and integrating over 70 million related entities and their keywords. It’s essentially a cross-referenced dictionary of keywords, relating each organization to its brands, products, associated executives, names, nicknames, and their exchange identifiers in the case of public companies.
Entities within the Knowledge Graph are updated weekly and tagged to ensure changes are correctly tracked. The CEO of a company today, for example, may not be the CEO tomorrow, and brands may be bought and sold, changing the parent company with each sale. Weekly updates within the Knowledge Graph ensure the system is aware of these changes.
Named entity disambiguation (named entity recognition plus entity linking) is one of the NLP techniques used to identify named entities in text sources using the entities mapped within the Knowledge Graph universe.
At SESAMm, NED identifies named entities based on their context and usage. Text referencing “Elon,” for example, could refer indirectly to Tesla through its CEO or to a university in North Carolina. Only the context allows us to differentiate, and NED considers that context when classifying entities. This method is superior to simple pattern matching, limiting the number of possible matches, requiring frequent manual adjustments, and cannot distinguish homophones.
SESAMm uses three other NLP tools to identify entities and create actionable insights. These are lemmatization, embeddings, and similarity. Each is explained in more detail below.
Analyzing the morphology of words with lemmatization
News articles, blog posts, and social media discussions reference organizations and associated entities in various forms and functions. Lemmatization seeks to standardize these references so the system knows they mean the same thing.
For example, “Tesla,” “his firm,” “the company,” and “it” are all noun phrases that can appear in a single article and refer to a single entity. Even where the reference is apparent, it can take different forms. For example, “Tesla” and “Teslas” both refer to the same entity but have slightly different meanings (semantics) and shapes (morphology).
The lemmatization process standardizes reference shape (morphology) to facilitate identification and aggregation. Lemmatization is a more sophisticated process than stemming, which truncates words to their stem and sometimes deletes information.
Encoding context and meaning with word embedding
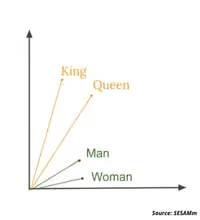
In NLP, embedding is a numerical representation of a word that enables its manifold contextual meanings to be calculated relationally. Embeddings are typically real-valued vectors with hundreds of dimensions that encode the contexts in which words appear and, thus, also encode their meanings. Because they are vectors in a predefined vector space, they can be compared, scaled, added, and subtracted. An example of how this works is that the vector representations of king and queen bear the same relation to each other as the representations of man and woman once you subtract the vector that represents royal.
Vectorized representation of embeddings
Using embedding is key to analyzing how words change meaning depending on context and understanding the subtle differences between words that refer to the same concept: synonyms. For example, the words business, company, enterprise, and firm can all refer to the same thing if the context is “organizations.” But they represent different things and even different parts of speech if the context changes.
In the phrase, “[Tesla] will be by far the largest firm by market value ever to join the S&P,” for example, one could replace the word firm with company or enterprise without affecting the meaning significantly. Contrast that with “a firm handshake,” where a similar substitution would render the phrase meaningless.
Also, words referring to the same concept can emphasize slightly different aspects of the concept or imply specific qualities. For example, an enterprise might be assumed to be larger or to have more components than a firm. Embeddings enable machines to make these subtle distinctions.
One advantage of using embedding is that it’s practical because it’s empirically testable. In other words, we can look at actual usage to determine what a word means.
Another advantage is that embeddings are computationally tractable. This understanding of a word’s definition allows us to transform words into computation objects to programmatically examine the contexts in which they appear and, thus, derive their meaning.
As lemmatization is an improvement on stemming, embeddings improve techniques such as one-hot encoding, which is close to the common conception of a definition as a single entry in a dictionary.
SESAMm uses the global vectors for word representation (GloVe) algorithm to generate embeddings. It’s an unsupervised learning algorithm that begins by examining how frequently each word in a text corpus co-occurs with other words in the same corpus. The result is an embedding that encapsulates the word and its context together, allowing SESAMm to identify specific words in a list and different forms of the listed words and unlisted synonyms.
GloVe is an extension of recent approaches to vector representation, combining the global statistics of matrix factorization techniques like latent semantic analysis (LSA) with the local context-based learning of word2vec. The result is an unsupervised algorithm that performs well at capturing meaning and demonstrating it on tasks like calculating analogies and identifying synonyms.
BERT is another algorithm used by SESAMm to generate embeddings. BERT produces word representations that are dynamically informed by the words around them. Google developed the technique, and it’s what’s known as a transformer-based machine learning technique, which means it doesn’t process an input sequence token by token but instead takes the entire sequence as input in one go. This technique is a significant improvement over sequential recurrent neural network (RNN) based models because it can be accelerated by graphics processing units (GPUs).
SESAMm uses BERT for multilingual NLP of its extensive foreign language text because it has been retained using an extensive library of unlabeled data extracted from Wikipedia in over 102 languages. BERT model was trained to predict words from context and next sentence prediction where it was trained to predict if a chosen following sentence was probable or not given the first sentence. As a result of this training process, BERT learned contextual embeddings for words. Due to this comprehensive pre-training, BERT can be finetuned with fewer resources on smaller datasets to optimize its performance on specific tasks.
Linking words, sentences, and topics with cosine similarity
Cosine similarity with centered means it’s identical to the correlation coefficient, which highlights another element of the computational tractability of the embeddings approach. It makes it easy to compare words and contexts for similarity.
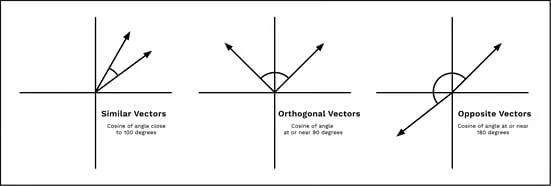
Converting words to vector representations means we can quickly and easily compare word similarity by comparing the angle between two vectors. This angle is a function of the projection of one vector onto another. It can identify similar, opposite, or wholly unrelated vectors, which allows us to compute the similarity of the underlying word that the vector represents.
Two vectors aligned in the same orientation will have a similarity measurement of 1, while two orthogonal vectors have a similarity of 0. If two vectors are diametrically opposed, the similarity measurement is -1. In practice, negative similarities are rare, so we clip negative values to 0.
Vectorized representation of cosine similarities
Cosine similarity measures whether two words, sentences, or corpora are close to one another in vector space or “about” the same thing in semantic space. To answer the question, “Is this sentence referencing company X?” we embed the sentence using the process described above and compute the cosine similarity between the sentence and the embedded company profile. Analogously, we compute similarities between sentences and the ESG topics SESAMm monitors by taking the maximum similarity between a sentence and each embedded keyword associated with an ESG topic.
These similarities allow us to identify whether a sentence references fraud, tax avoidance, pollution, or any other ESG risk topic among the more than 90 that SESAMm tracks across the web.
Similarities within ESG topics combine with word counts to resolve the recall and precision problem. Word counts are precise because if a word is identified within a context, then that context, by construction, references the topic.
The virtue of using these NLP techniques is that even if a given keyword list does not include every possible combination of words that a person might use to discuss a topic, relevant entities missed by the word-count process will be identified through vector similarity.
This is the power of SESAMm’s NLP expertise. We can scan many lifetimes’ worth of data in seconds to find the concepts you explicitly ask for and the concepts relevant to your search but that you did not think of yourself.
Sentiment analysis with deep learning and neural networks
Once we’ve identified the concepts and contexts of interest in all the forms they appear, we analyze the context to determine the speakers’ attitudes.
We use sentiment classification models to score a sentence with three possible outcomes: negative, neutral, or positive. The current classification models are based on deep learning AI technologies. Specifically, we stack convolutional neural networks with word embeddings and bayesian optimized hyperparameters—parameters not learned during training. This architecture improves the accuracy and enables fast shipping of production-ready models for a given language. We also produce state-of-the-art frameworks with architecture variations enabling multilingual capabilities, such as transformers and universal sentence encoders.
Condensing information and extracting insights with daily aggregation
Similarities, embedded word counts, and sentiment are state-of-the-art tools for processing unstructured text data. The same tools are effective cross-linguistically.
Once the information has been extracted from millions of data points, it’s aggregated and condensed into actionable insights.
All entities are referenced directly or indirectly within an article. Then, sentence-level references are aggregated to obtain an article-level perspective, and finally, all relevant articles are aggregated to gain an entity-level view of that day.
In this way, reams of data are compressed into several metrics to provide a daily aggregate view for each entity, highlighting trends at a sentence, article, and entity-level comparable over a multi-year history.
ESG analysis use cases
SESAMm’s TextReveal Streams is used in various investment domains, from asset selection to alpha generation and risk management. Systematic hedge funds track retail interest in real time to identify investment opportunities and protect their existing positions. In the Private Equity industry, equity and credit-deal teams use the data in various ways, from monitoring consumer perspectives via forums and customer reviews for evaluating deal prospects to estimating due diligence risks, all to help make investment decisions. Dedicated teams use our data for monitoring portfolio companies for ESG red flags that conventional ESG reporting might miss.
Below are two examples of how aggregated TextReveal Streams data can be used to help identify investment risk and opportunity.
LFIS CapitalL: ESG signals for equity trading
ESG controversies can significantly impact asset prices in the short term, and it’s now estimated that intangible assets, including a company’s ESG rating, account for 90% of its market value.
Working in partnership with LFIS Capital (LFIS), a quantitative asset manager and structured investment solutions provider, SESAMm developed machine learning and NLP algorithms that could analyze ESG keywords in articles, blogs, and social media, to generate a daily ESG score specific to each stock, which is part of the TextReveal Streams’ platform’s core functionality.
The results were promising when these scores were incorporated into a simulated strategy for trading stocks in the Stoxx600 ESG-X index.
A simulated long-only strategy running between 2015 and 2020, using the signals, delivered a 7.9% annualized return, 2.9% higher than the benchmark for similar annualized volatility (17.3% vs. 17.1%). The information ratio of the strategy was greater than 1, with a tracking error of 2.8%. Results for the previous three years were compelling, reflecting the growing interest and news flow around ESG themes.
Researchers also backtested a hypothetical long-short strategy for all stocks in the Stoxx600 ESG-X index with a market cap of over $7.5bn. This investment strategy delivered a Sharpe ratio of approximately 1 with annualized returns and volatility of 6.1% and 5.9%, respectively, between 2015 and 2020. Like the long-only strategy, returns were particularly robust over the three years up to 2020: +6.0% in 2018, +7.3% in 2019, and +11.3% in 2020.
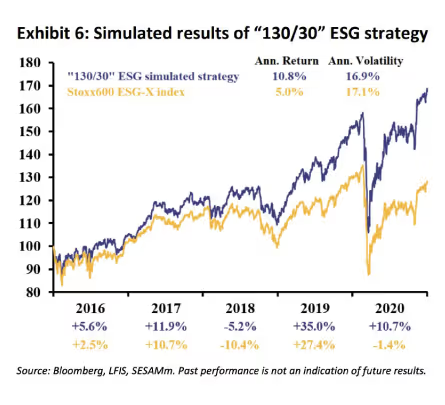
Finally, a simulated “130/30” ESG strategy that combined 100% of the long-only ESG strategy and 30% of the long-short ESG strategy delivered a 10.8% annualized return, 5.8% higher than that of the Stoxx600 ESG-X index. Annualized volatility was similar at 16.9% vs. 17.1%. The strategy experienced a tracking error of 3.8% and an information ratio of over 1.5, with a consistent outperformance each year.
Disclaimer: Past performance is not an indicator of future results. Theoretical calculations are provided for illustrative purposes only. The investment theme illustrations presented herein do not represent transactions currently implemented in any fund or product managed by LFIS.
Wirecard: ESG sentiment and volume as predictive indicators
The Wirecard scandal broke on June 21, 2020, when newswires carried the story that the major German payment processor had filed for bankruptcy after admitting that €1.9 billion ($2.3 billion) of purported escrow deposits did not exist.
Could SESAMm’s TextReveal Streams platform have provided investors with an early warning that the scandal was about to break?
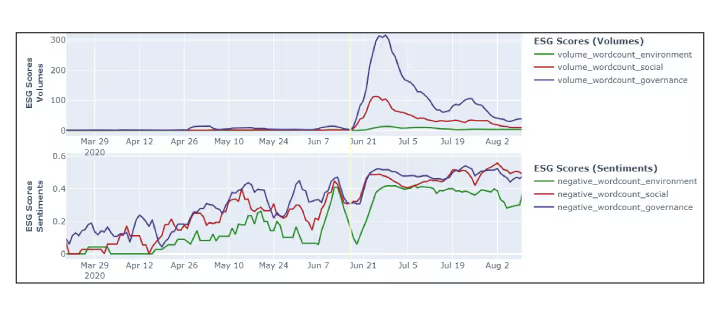
The following chart derived from the platform shows how key ESG metrics, including ESG scores (volumes) and ESG scores (sentiment), reacted to the news.
An analysis of the charts pinpoints a shallow rise in the ESG scores (volumes) time series in the early part of June before the eruption on June 21.
The ESG scores (sentiment) metric also shows a steady increase in negative sentiment for governance, the most relevant of the three ESG factors regarding the scandal.
How key ESG metrics, including ESG scores (volumes) and ESG scores (sentiment), reacted to the Wirecard scandal news.
Additionally, before the crash, governance was the most negative of the three ESG factors most of the time. This was especially the case from late March to early April, and then before the scandal in early June, negative governance sentiment diverged higher from the other two.
The rate-of-change of negative governance sentiment as it rose and peaked in early June before the scandal broke was also extremely high, perhaps providing the basis for an early warning signal.
Portfolio managers who had been keeping an eye on the reputational slide in Governance for Wirecard may have decided the company was at high risk of a negative controversy emerging, giving them cause to drop the stock before the event.
In this way, it can be seen how while not providing a hard and fast early warning signal, SESAMm’s ESG scores can, nevertheless, be used as the basis for developing a data-driven, rules-based portfolio management approach that can help investors avoid high-risk candidates like Wirecard.
SESAMm takes on ESG data challenges
SESAMm’s NLP and AI tools analyze over four million data sources daily to identify thousands of public and private companies and their related products, brands, identifiers, and nicknames, turning reams of unstructured text into structured and actionable data.
SESAMm’s TextReveal Streams platform can be used in many quantitative, quantamental, and ESG investment use cases. TextReveal is a solution that allows you to fully leverage NLP-driven insights and receive high-quality results through data streams, modular API and dashboard visualization, and signals and alerts.
Learn how SESAMm can support you in your investment decision-making and request a demo today.
To request a demo or for access to the full SESAMm Wirecard or LFIS reports, contact us here:
Wildfires used to be a summer story. For most of the last decade, they arrived with the Northern Hemisphere dry season, dominated a few weeks of headlines, and receded once the rains came. That is no longer a safe assumption. Los Angeles burned in January 2025, a month that has historically been the quietest of the year for wildfire news anywhere in the world. Canada lost more forest in 2023 than in any year in its recorded history. Greece, Spain, and Portugal now post record-breaking fires in years that are not supposed to be their worst.
Given how much the pattern itself seems to be changing, we wanted to look past the headlines and into the data: how has coverage of wildfires actually moved over the past seven years, what does the aftermath of these fires look like once the smoke clears, and which countries, and companies, keep reappearing in the story. The analysis below sets out what the data shows, and, where it helps to understand it, what was actually happening on the ground at the time.
Executive summary
This analysis reviews global wildfire mentions between 2019 and 2026 across three lenses: quarterly mention volume, ESG sub-risk classification, and country-level geographic distribution, cross-referenced against documented public reporting. Three findings stand out: (1) wildfire coverage has shifted from a seasonal pattern to a sustained, year-round baseline since 2023; (2) coverage volume tracks proximity to population centers and identifiable liable parties more closely than it tracks the physical scale of the fire itself; and (3) the dominant subject matter in wildfire-related ESG coverage is the aftermath (casualties, contaminated water and air, insurance exposure, litigation) rather than the fire event in isolation.
1. Mention volume over time: a seasonal story becomes a year-round one
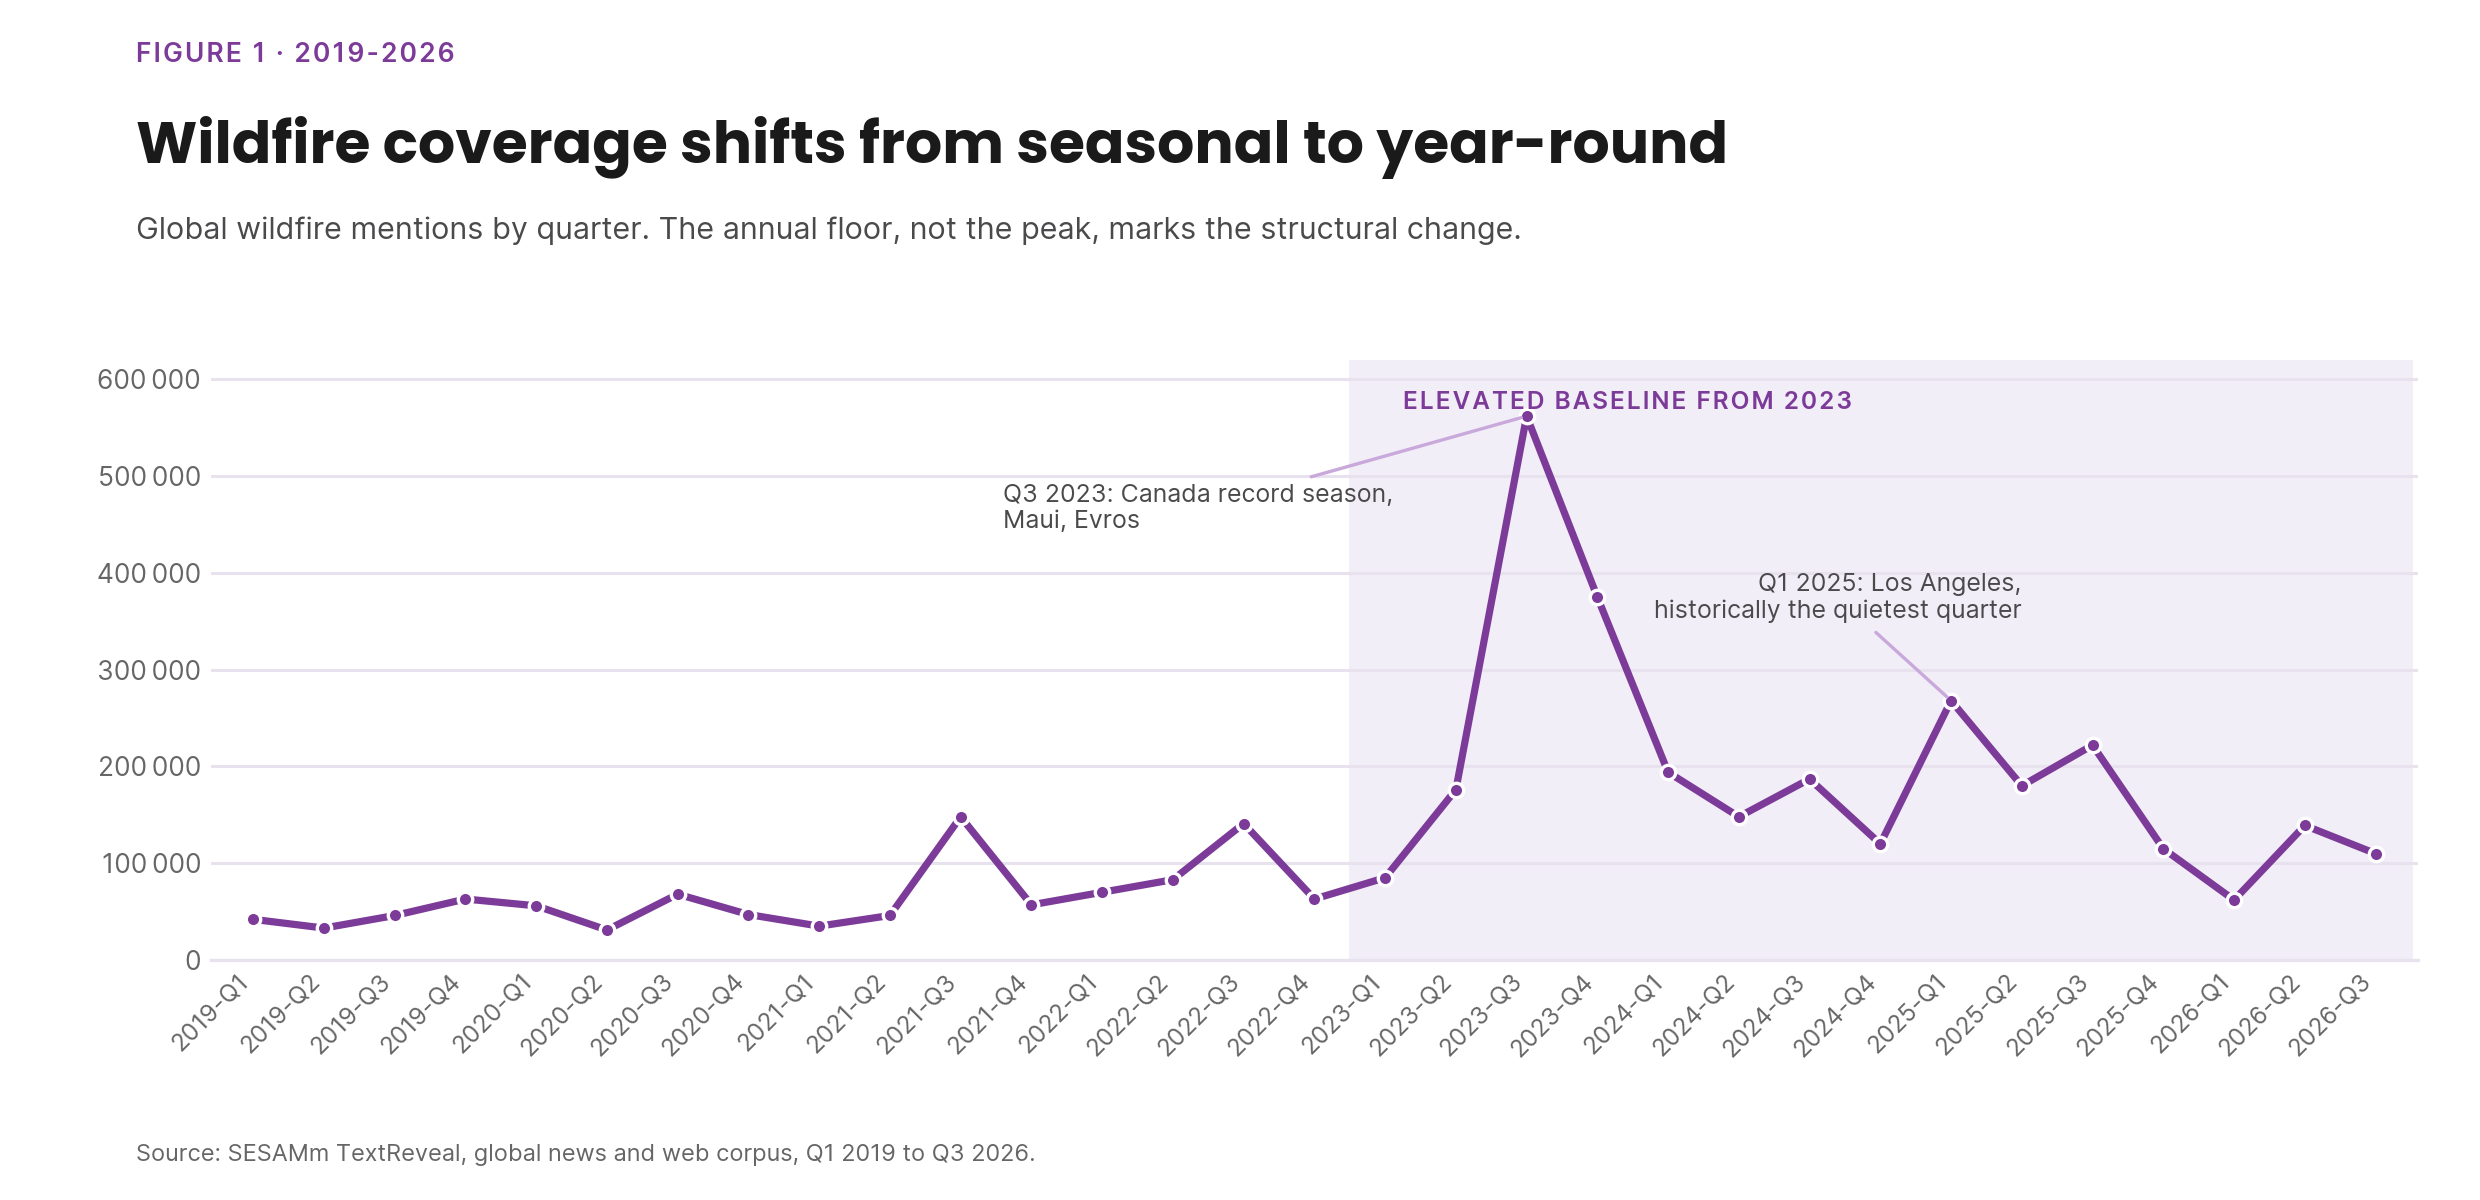
For most of the period, the data follows a predictable four-quarter cycle: Q1 is the annual low, Q2 shows a moderate rise, Q3 spikes with the Northern Hemisphere dry season, and Q4 falls back. That cycle breaks in two places, and both breaks mark a structural change rather than a one-off event.
Q4 2023 does not return to baseline after the Q3 peak: coverage stays elevated into the final quarter for the first time in the dataset.
Q1 2025, historically the lowest-volume quarter of the year, reaches roughly 270,000 mentions, more than several previous Q3 peaks.
The floor is the more telling number. In the quarters before 2023, non-peak volume rarely exceeded 80,000 mentions. From 2023 onward, even the quietest quarters do not fall below roughly 110,000–190,000. Wildfires have moved from a seasonal hazard to a year-round subject of coverage.
It's worth noting what does not explain this shift: acreage burned. 2020 through 2022, the years directly before this data climbs, include some of the largest fires by area in modern US and European history, yet register comparatively modest mention volume, partly because those years overlapped with the COVID-19 pandemic, which absorbed a large share of global news capacity.
The years that do dominate the chart, 2023 and 2025, are not necessarily the years with the most land burned; they are the years fire reached population centers and produced an identifiable party to blame. The Lahaina, Marshall, and Los Angeles fires are all comparatively small by area next to the 2020 US West Coast season or Canada's 2023 season, but generated substantially more coverage because of death toll, structures destroyed, and utility liability. Acreage, in short, is a weak predictor of coverage; proximity and blame are strong ones.
What was happening on the ground behind each peak
Each Q3 peak in the dataset lines up with a specific, documented cluster of events:
Q3 2022: fires threaten the Yosemite region and Sequoia groves in California; Spain and Portugal report wildfires during a European heat wave; a federal review attributes a New Mexico wildfire to a botched prescribed burn.
Q3–Q4 2024: a wildfire cuts power to Labrador; another burns near Suncor's Firebag oil-sands site in Alberta; Jasper, Alberta is significantly damaged; Greek investigators attribute the country's worst fire of the year to a faulty power cable.
Q1 2025 (the anomaly): a 14-fire outbreak tears through Los Angeles and San Diego County over January 7–31 on Santa Ana winds; the Palisades and Eaton fires alone destroy more than 18,000 structures and kill at least 31 people, with over 200,000 evacuated. Property-value loss is estimated at roughly $31 billion by CoStar, with total economic loss estimated between $250–275 billion by AccuWeather. Days later, the European Forest Fire Information System reports more than 100,000 hectares burned across the EU by the end of March, three months ahead of the typical season.
Across every year in the dataset, the same mechanism converts a fire into a sustained story: ignition (lightning, arson, or utility equipment failure) combines with drought and wind to produce the initial event, but litigation and identified liability sustain the coverage long after the fire is contained. PG&E, Southern California Edison, PacifiCorp, and Hawaiian Electric recur as named defendants across separate fires and separate years.
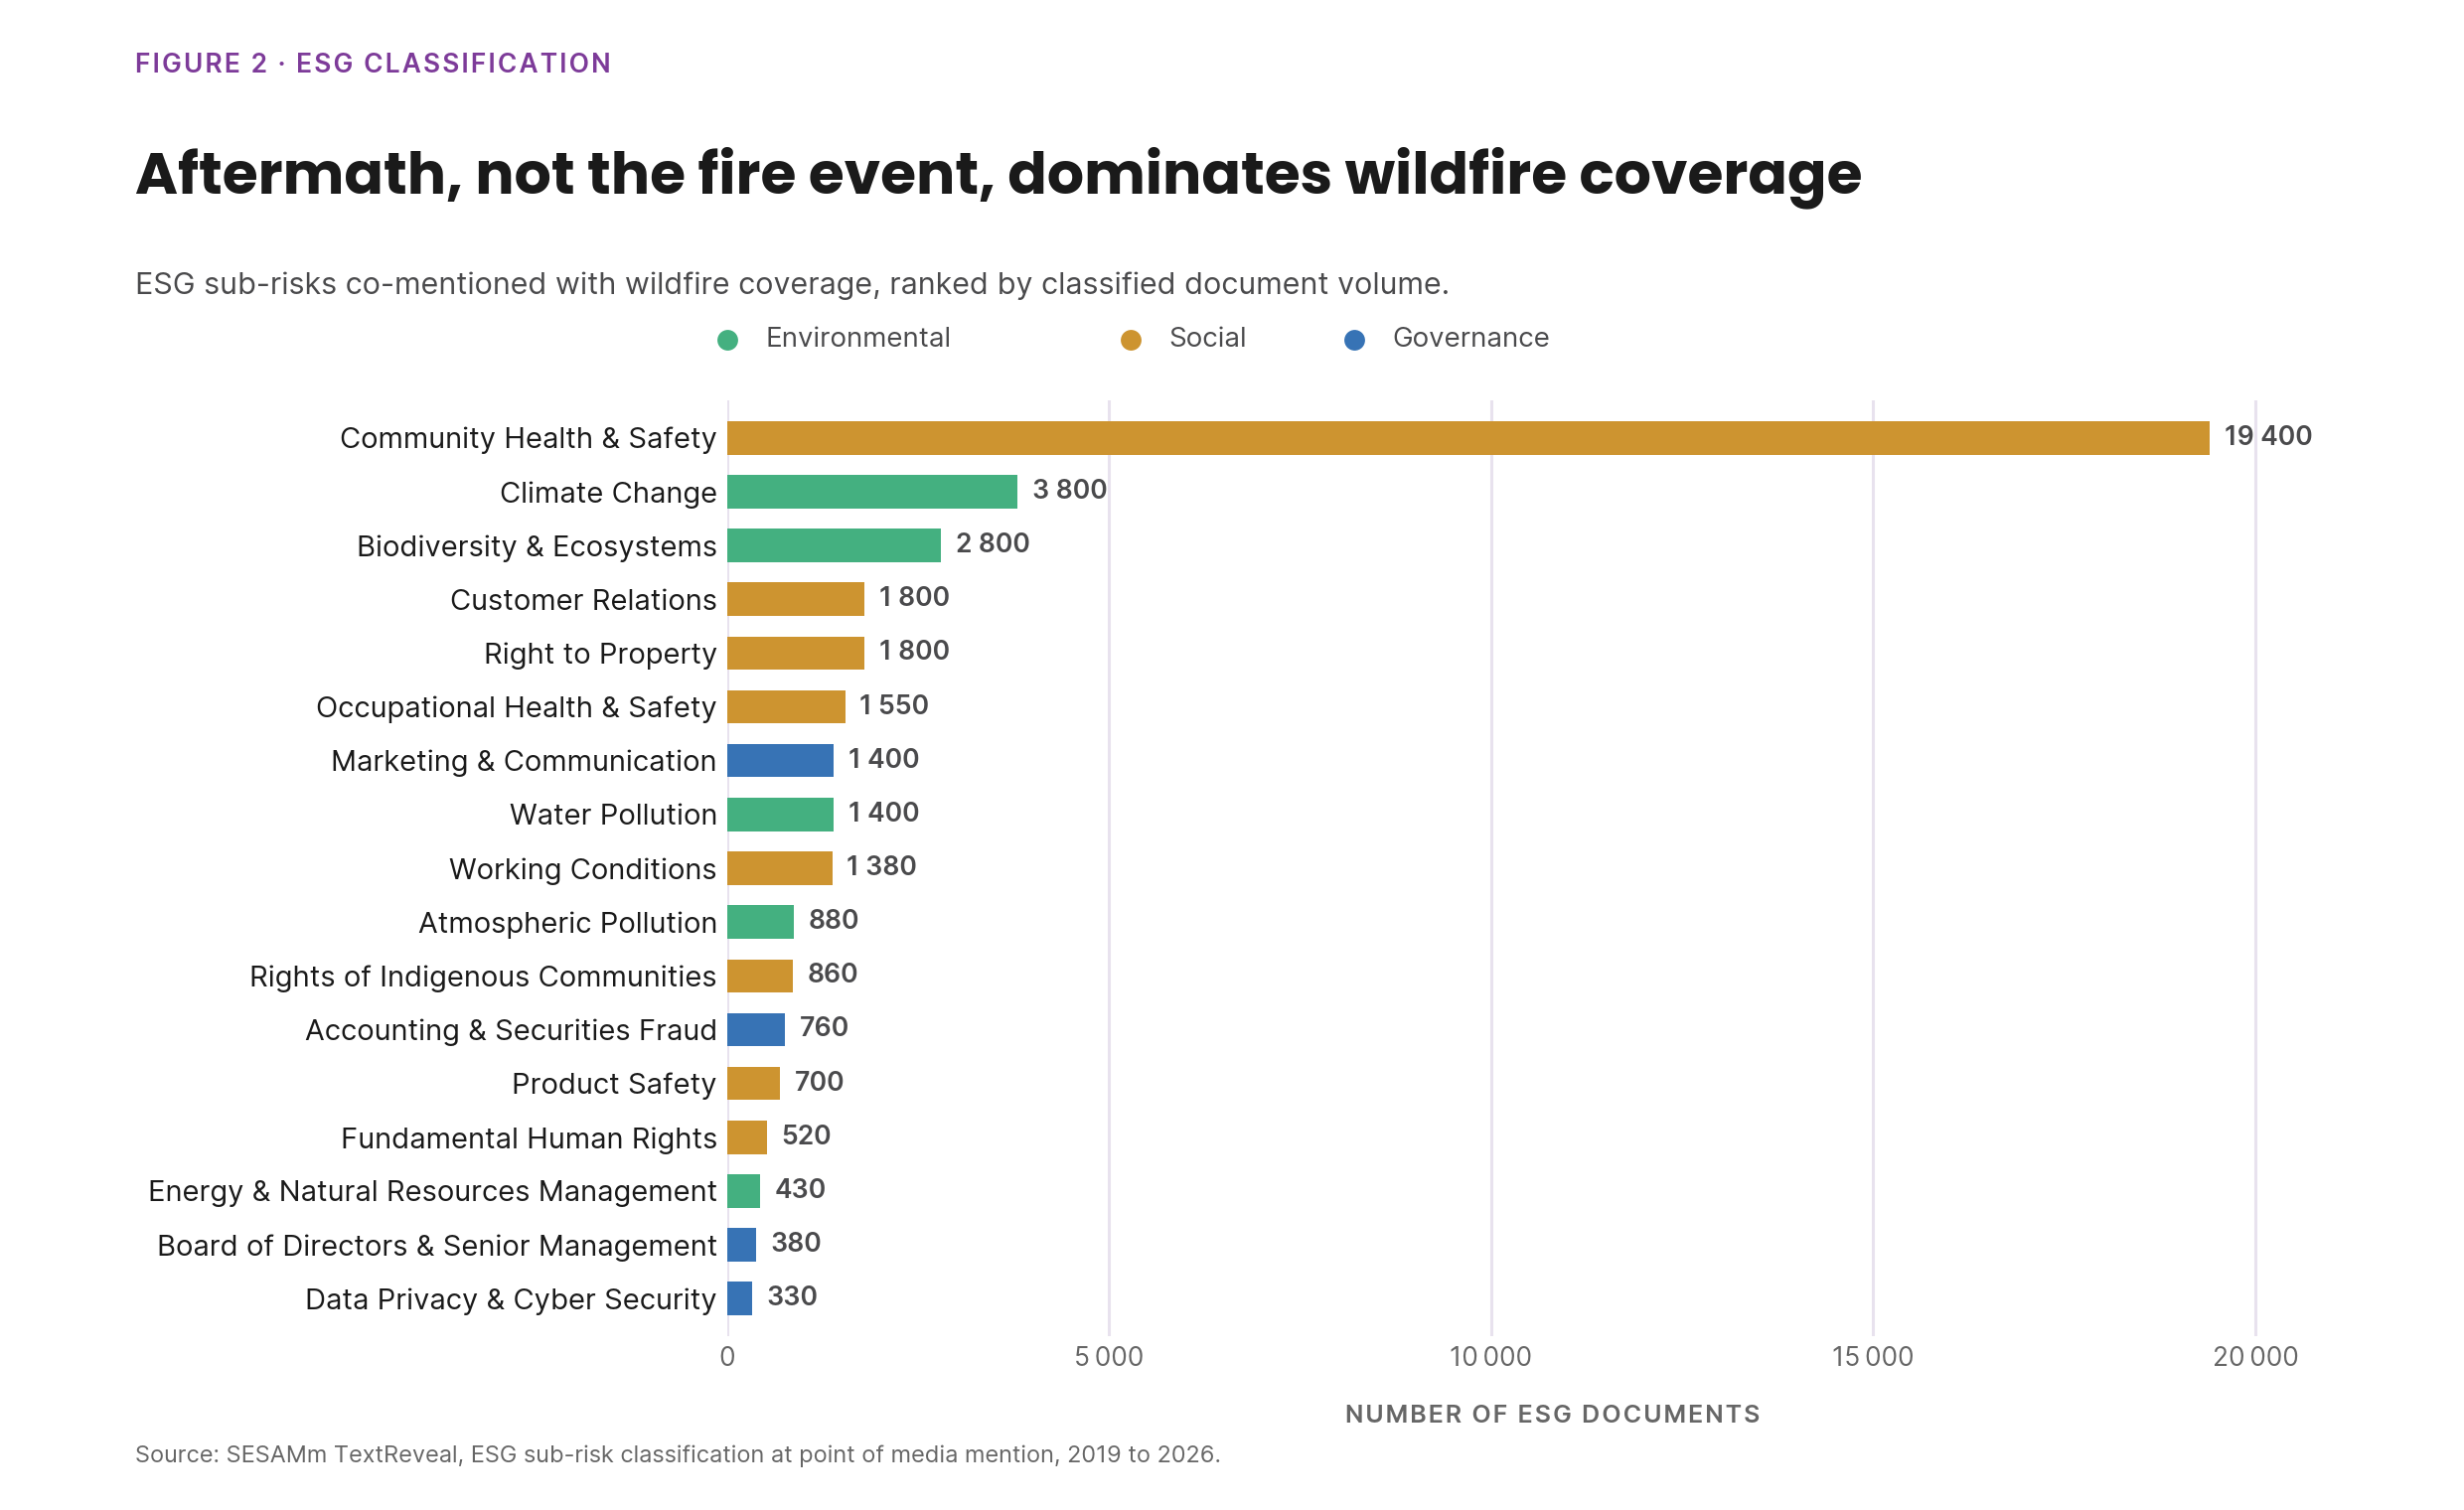
Wildfire-related controversies were classified into ESG sub-risk categories at the point of media mention. The ranking below runs from highest to lowest mention volume, with a documented, sourced example behind each category.
Climate Change: wildfires are framed as both symptom and accelerant. Canada's 2023 season burned at roughly seven times the historical average; researchers found climate change had tripled the underlying fire risk in the country's boreal forest, and the season released an estimated 1.5 billion metric tons of CO2, comparable to a decade of Canada's typical wildfire emissions.
Customer Relations: reflects the California property-insurance crisis: State Farm nonrenewed roughly 72,000 California policies in the two years before the January 2025 fires, then faced a state investigation into claims handling, including denial of hygienic smoke-damage testing, after the fires it did cover. A $1 billion FAIR Plan assessment was subsequently levied on insurers operating in California.
Right to Property: tied to the scale of destroyed real estate, an estimated $31 billion in property value destroyed in the January 2025 Los Angeles fires, and to litigation over responsibility for that loss, including Los Angeles County's lawsuit against Southern California Edison and Edison's countersuit against the county.
Marketing & Communication: covers corporate communications during active disasters, including relief pledges, the Recording Academy and MusiCares pledged $1 million to Los Angeles wildfire relief in January 2025, and utility crisis messaging, which came under renewed scrutiny after Edison International executive pay continued to rise during the period the company faced Eaton Fire liability claims.
Working Conditions: wildland and municipal firefighting workforce strain during extended, overlapping fire seasons across multiple continents.
Atmospheric Pollution: principally the June 2023 Canadian smoke event: New York City's air quality index peaked at 465, with a 24-hour PM2.5 average nearly three times the US regulatory standard, and follow-on research linked the event to a 44–82% increase in asthma-related emergency-department visits in the city.
Accounting & Securities Fraud: the Edison International shareholder class action filed after the Eaton Fire, alleging the company misrepresented the readiness of its power-shutoff program; Edison's share price fell approximately 34% following the fire, and the suit names CEO Pedro Pizarro and CFO Maria Rigatti as defendants.
The remaining categories (Product Safety, Fundamental Human Rights, Energy & Natural Resources Management, Board of Directors & Senior Management, and Data Privacy & Cyber Security) account for smaller shares of classified documents and were not tied to a comparably documented recurring event pattern in this dataset.
3. Geographic distribution of coverage
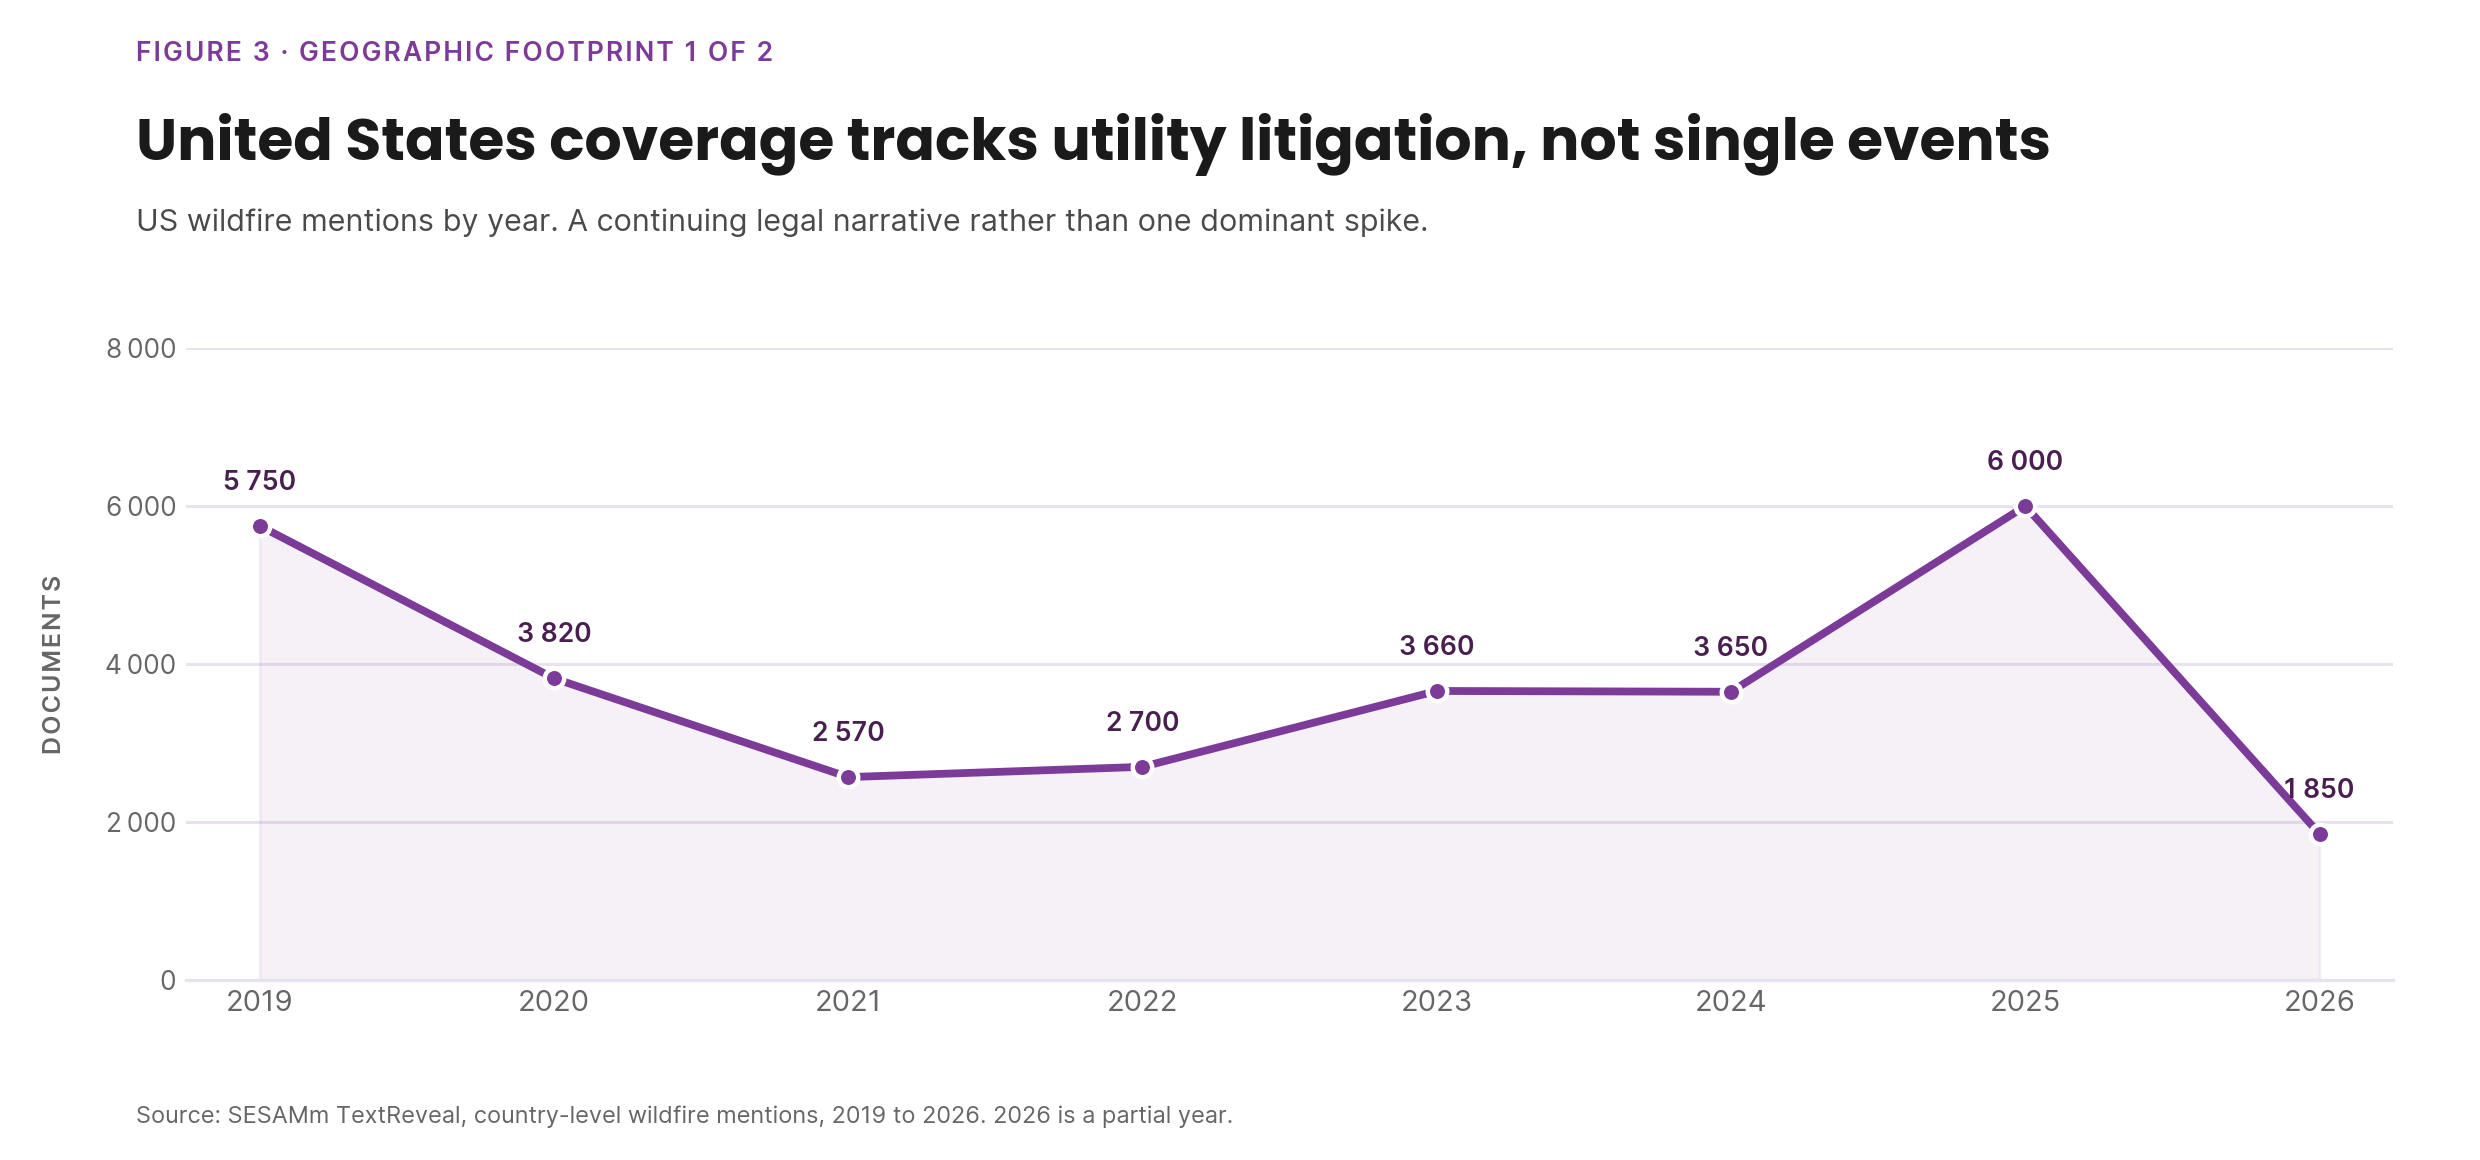
The United States accounts for the largest share of country-level mentions throughout the period, without a single dominant spike: volume rises through 2023–2025, peaks around 2025, then falls sharply into 2026. That shape fits a continuing sequence of named utility liability cases (PG&E, Southern California Edison, PacifiCorp) more than it fits a single event.
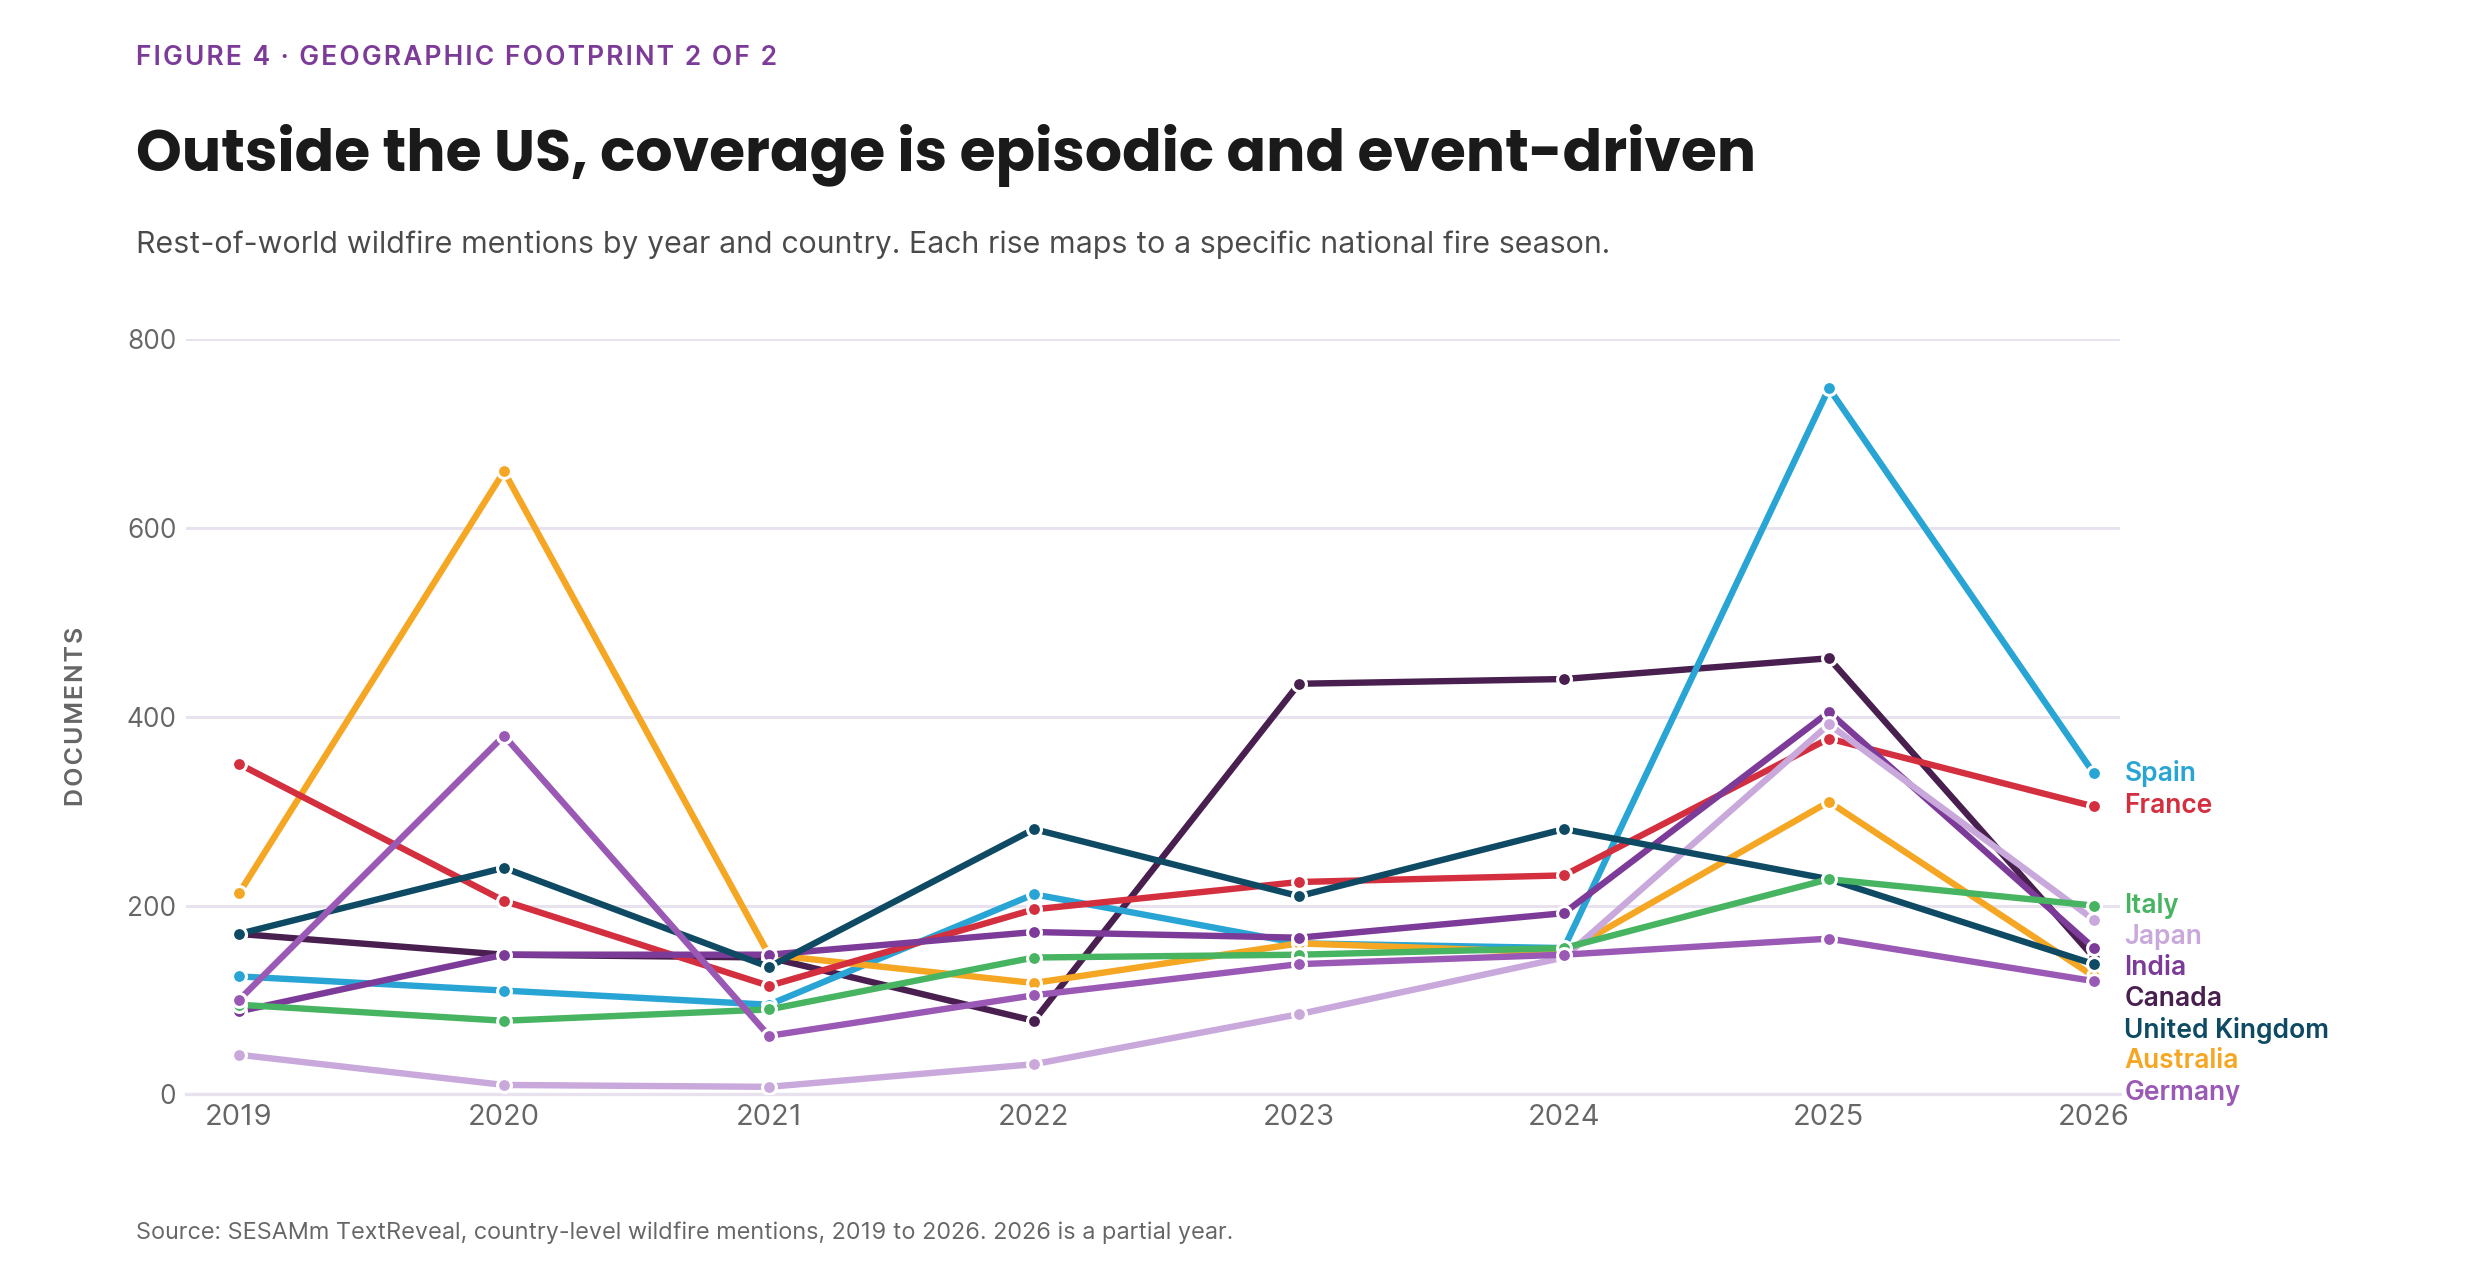
Outside the US, coverage is more episodic, clustering around identifiable national events rather than building a sustained baseline:
Australia peaks sharply around 2019–2020, matching Black Summer (24 million hectares burned, 33 deaths, an estimated three billion animals affected), then recedes.
Canada rises from 2022 and peaks around 2025, matching the record 2023 season (roughly 15–18 million hectares, eight firefighter deaths, up to 232,000 evacuated) and the continuation of large fires in 2024, including Jasper.
Greece shows a sustained late-period rise, matching the 2023 Rhodes evacuation and the Evros fire, followed by continued fire activity in 2024, including the faulty-power-cable fire investigators called the country's worst of the year.
Spain shows its highest point at the end of the series, consistent with the unusually early 2025 season (100,000+ hectares burned across the EU by end of March) and recurring summer wildfire and heat-wave coverage in 2022.
France, Germany, India, Italy, Japan, and the United Kingdom register comparatively low, stable volumes throughout, with modest increases around 2024–2025 in line with the broader post-2023 elevated baseline rather than country-specific events.
Read together, US coverage behaves like an ongoing institutional and legal narrative anchored by utility litigation, while rest-of-world coverage behaves like a series of discrete, event-driven spikes tied to specific fire seasons.
Conclusion
Across mention volume, ESG classification, and geography, the evidence points to a consistent mechanism. Coverage volume is driven primarily by three factors: proximity of the fire to population centers, the presence of an identifiable liable party, typically a utility, and how much a competing global news cycle is absorbing attention capacity at the same time. The physical scale of a fire is, on its own, a comparatively weak predictor of how much coverage it receives. On that basis, the next spike in wildfire coverage is more likely to come from an urban-interface fire with a clear liability story than from the largest fire by area.
Stay ahead with the latest in ESG and AI intelligence
Join our mailing list to receive new reports, event invites, and updates from SESAMm directly to your inbox.









.png)