


If I told you that I had a crystal ball and could predict the future, you’d probably laugh in my face. But what if I told you that this crystal ball could give you seemingly invisible data indicating what the future is likely to be, helping you make better investment decisions? Did your ears perk up? I bet they did.
Alternative data, specifically natural language processing (NLP)-generated alternative data, is like a crystal ball. It can help portfolio managers, analysts, and public equity investment managers make better decisions by identifying controversies about a company or potential investment before mainstream data providers and ESG rating firms can. That means you can take data-informed actions before a possible change in your investment value occurs.
That was a lot, so before we go further, let’s cover a quick basic as a refresher.
What is alternative data?
Alternative data is non-traditional information extracted from non-traditional data sources, such as internet social media communities and deeper-level article data. This subset of big data is often nonfinancial and unstructured.
Why use alternative data for finance?
In financial services, alternative data sets give investors insight into the investment process and guide their investment strategies. For example, quant hedge fund managers, asset managers, and private equity firms use alternative data to augment conventional data like those that come from quarterly financial statements and SEC filings. This unconventional data can reveal insights such as metrics on environmental, social, and corporate governance (ESG) information, sentiment analysis, and consumer behavior.
Where does alternative data come from?
Firms, such as data vendors or alternative data providers, find raw data from various sources, depending on the details you need. For instance, they can pull data from transaction data, like credit card transactions, text data from social media platforms and obscure media publishers. They can also extract information from technologies like satellite imagery and geolocation data, IoT sensors, web traffic, app usage, and new data sources yet to exist. All to say, alternative-data sources are found anywhere unconventional, valuable data live.
How does NLP-generated alternative data differ?
NLP-generated alternative data is more than raw data collection and presentation. Instead, it reveals the hard-to-see data and interprets it so you can make better decisions. At SESAMm, for example, we generate alternative data from text using NLP algorithms on a massive, ready-to-use data lake to identify noteworthy trends. Our developers and data scientists then use their machine learning technology to analyze these trends and build investment strategies for our clients.
How can alternative data identify controversies before mainstream providers and ESG rating firms?
There are two main ways alternative data identifies controversies before mainstream providers and ESG rating firms:
First, NLP-generated alternative data’s inherent quality is that it can reveal trends that mainstream providers and ESG firms can’t. And because of this quality—the ability to identify and analyze trends—you can use it to see warnings before a major controversy hits the mainstream.
Second, rating providers can be inconsistent and inaccurate, according to Andrew McLaughlin, a contributor to The Globe and Mail. He states that many ESG rating providers, for instance, are “popping up like dandelions,” and “each uses its own methodologies to rank and score publicly traded companies based on their purported environmental, social and governance risk and performance.” Further, “[their] reports produced are at times rife with inaccuracies,” McLaughlin says. While we at SESAMm might not agree with McLaughlin completely, we believe that alternative data helps bridge the gap between possible shortcomings and a more comprehensive view of an investment’s risks and opportunities.
2 NLP-generated alternative data use cases as examples:
Ericsson (ERIC) analysis
Event: On February 16, 2022, Ericsson investigates an in-house bribery scandal tied to ISIS. According to FIERCE Wireless, “investors reacted to reports that Ericsson may have made payments to the ISIS terror organization to gain access to certain transport routes in Iraq.”
Results: Ericsson’s share value dropped by at least 15% that day as news broke and investors reacted. “It was its biggest share drop in a day since July 2017,” per FIERCE Wireless.
What did NLP-generated alternative data see?
In Ericsson’s case, we analyzed three areas from January 2016 to the event on February 16, 2022:
- Name-mention volume
- Sentiment polarity
- ESG Initiatives Score
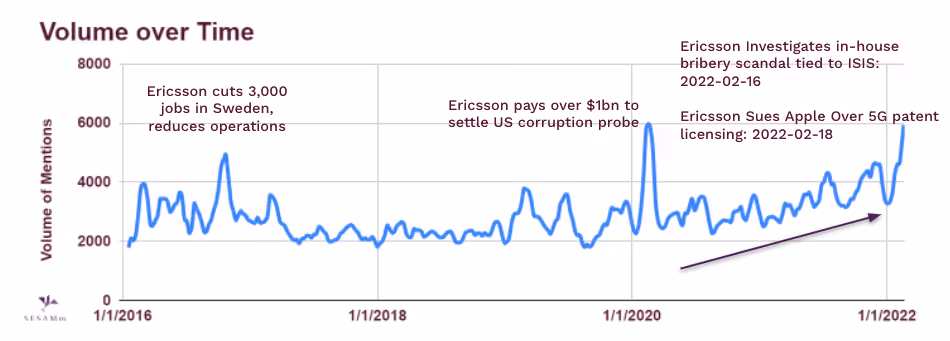
In Figure 1, we chart our analysis of data volumes, indicating spikes to help detect significant positive or negative events. For instance, the payment scandal similarly affected mention volume as a controversy in 2020. Mentions related to the more recent events continue to increase, making it potentially Ericsson’s most controversial issue so far.
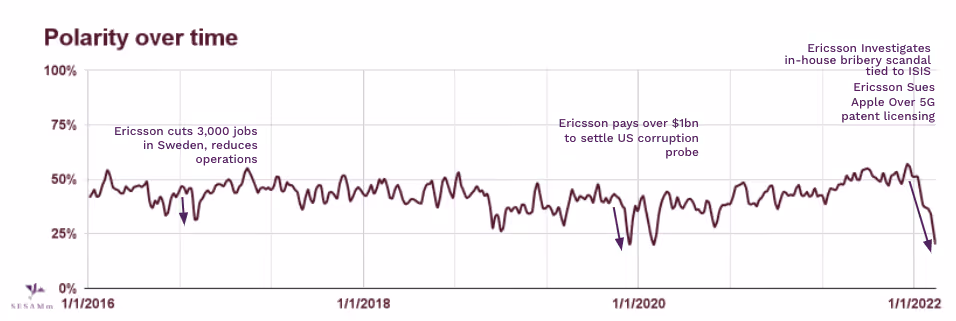
In Figure 2, we analyze Ericsson’s polarity over time. Polarity represents the aggregate of positive and negative sentiment (opinions, reviews) on a company. It can range from -1 to 1. A 0 score means that as much positive as negative sentiment is expressed. High e-reputation brands can have polarity scores over 0.7, based on SESAMm’s research and findings.
Ericsson’s overall polarity sits in the average range for the most part. However, we found that Ericsson’s sentiment suffered significant negative drops caused by controversial news. In other words, the company’s reputation has been affected several times over the years, with the most recent controversies going viral and perceived as very negative.
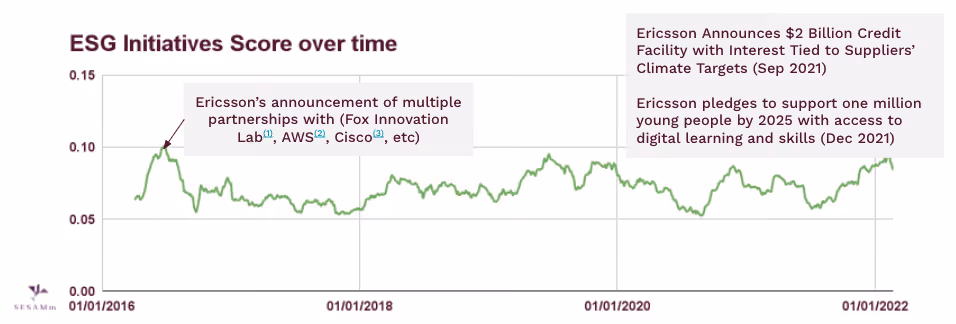
In Figure 3, SESAMm used the analyzed areas and comparisons to compute an ESG Score based on proprietary ESG initiatives data. The scale ranges from 0 to 1, with zero indicating a low and undesirable value and one having a higher and desirable value. We score Ericsson in the 0.05–0.10 range, which we think is relatively low for this company. Despite Ericsson increasing its ESG initiatives over the past year, recent controversies have affected its score negatively.
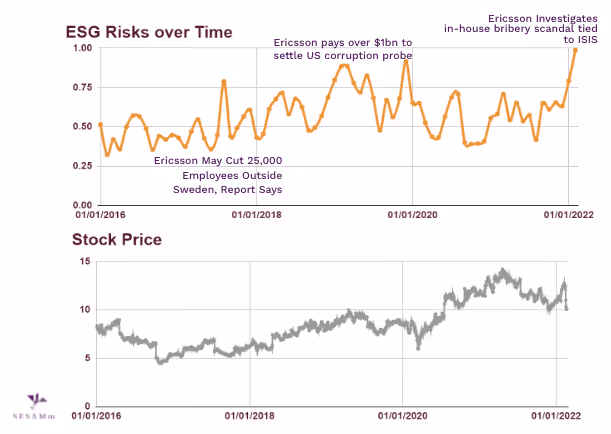
Figure 4 charts Ericsson’s ESG risk, which is based on SESAMm’s web data. The range varies from 0 to 1, zero indicating the lowest risk and one as the highest. Ericsson’s score from its latest scandal is a 1. Compared to Ericsson’s stock prices, several spikes in ESG risk anticipated market movements.
Orpea SA (ORP:FP) analysis
Event: On January 24, 2022, Le Monde published an article about the book “Les Fossoyeurs”. According to Le Monde, the book concentrates most of its attacks on Orpéa, a top nursing homes and clinics company, employing “65,000 employees in 1,100 establishments across the planet; 220 nursing homes in France alone.” The book’s author attacks the “Orpea system” and reveals reported elderly abuse and deaths possibly caused by it or negligence.

The media begins to question the limits of ESG rating because of Orpea’s scandal.
Results: Two things occurred after the news broke. One, Orpea’s stock price sustained a 44-point drop. Two, the media begins to question the limits of ESG rating, given Orpea’s rating at the time.
What did NLP-generated alternative data see?
In Orpea’s case, we analyzed three areas from January 2016 to the event on February 16, 2022:
- Name-mention volume
- Sentiment polarity
- ESG Initiatives Score
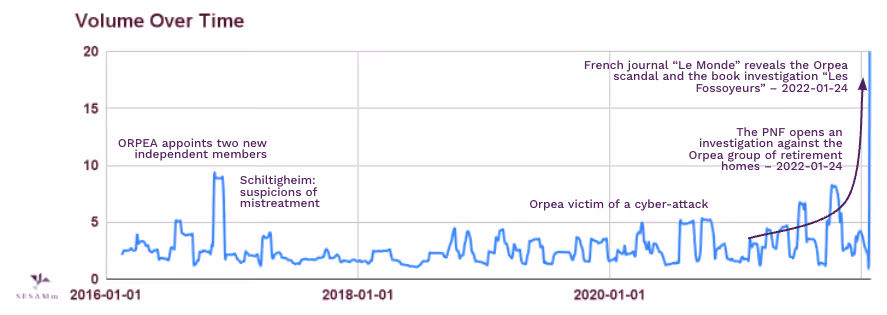
In Figure 5, we analyzed volumes of data and compared them with significant events detected. Volume spikes detect clear, negative events in Orpea’s case. For instance, on January 24, 2022, the breaking news had the highest effect since 2016. It’s worthy to note that an upward mention trend becomes visible before the scandal emerges, with volumes reaching levels higher than average.
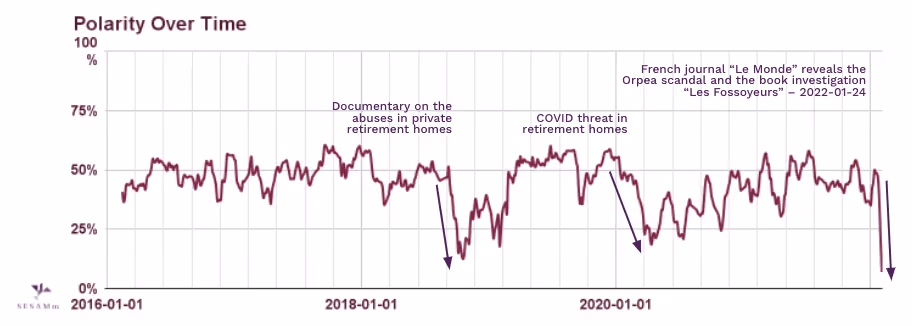
Orpea’s polarity is average, but it shows significant negative sentiment linked to scandals. One of those drops in opinion dates back to 2018 when a documentary highlighted abuses in private retirement homes.
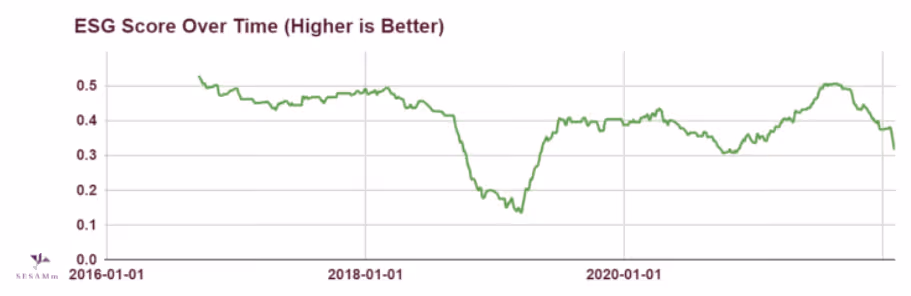
ESG scores, which range from 0 to 1, are relatively low for Orpea on average. Its controversies have strongly affected its scores in 2018 and 2022 in particular. But the trend to see in the chart is that Orpea’s ESG score had been trending downward for several months before Le Monde’s breaking story.
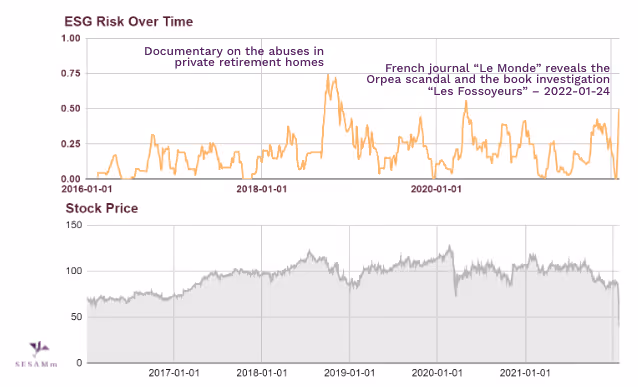
Figure 8 charts Orpea’s ESG risk, which is based on SESAMm’s web data. The range varies from 0 to 1, zero indicating the lowest risk and one as the highest. Ericsson’s score from its latest scandal is a 1. Compared to Orpea’s stock prices, several spikes in ESG risk anticipated market movements. The current controversy, while very viral, represents a risk equivalent to the 2018 revelations.
Summarizing SESAMm’s Ericsson and Orpea findings
NLP-generated alternative data was able to see trends and events that mainstream ESG rating firms didn’t in the Ericsson and Orpea cases. In both cases, SESAMm would’ve flagged controversies in at least three key areas, name-mention volume, sentiment polarity, and ESG Initiatives Score. And these three areas, with additional proprietary analysis from SESAMm, would’ve provided much-needed insight to investors before their respective market-moving events had occurred.
How SESAMm’s NLP-generated alternative data can help you
Whether for fundamental, quantitative, or quantamental investment use cases, to monitor your corporate risks, or to conduct advanced due diligence on private companies for investment opportunities, explore limitless possibilities using SESAMm’s industry-leading data lake. Our data lake consists of nearly 20 billion articles today, and it’s growing by 20% every year.
And if our data lake is our crystal ball, then TextReveal® is what fuels its magic. The data, in conjunction with TextReveal’s NLP algorithms, can reveal alternative data, such as emotion and sentiment data and ESG and risk metrics, on more than 70 million entities like:
- Assets
- Brands
- Product reviews
- C-level people
- And more
And you can easily access valuable alerts and predictive insights—from live daily or historical data—through dashboards, APIs, or flat files delivered in usable formats.
Are you ready to uncover the invisible data about your investments? Request a demo today.


.png)