

Inflation.
It's a word that most of us in the U.S. despise, almost as much as the word taxes. It's probably because, like taxes, we can't escape its wallet-draining effect when it increases. Maybe the way we feel about it is because the last time the U.S. economy deflated—giving us relief from it—was in the 1930s, when "Prices dropped an average of nearly 7% every year between the years of 1930 and 1933," according to Investopedia. But I digress.
We won’t go into how inflation works, but how the government calculates it—and how its categories affect it—has always been consistent. At least it was until the COVID-19 pandemic hit, that is.
What NLP text mining reveals about the U.S. economy inflation-rate factors and the online conversations about them
To ensure we're on the same page about how we came to the forthcoming information in this use case, let's cover a couple of basics on NLP text mining and inflation rate indexes.
What are NLP and text mining?
Natural language processing (NLP), an A.I. technology, automates the data analysis of mined textual, unstructured data. It includes natural language understanding and natural language generation to simulate a human’s ability to create language, and it’s a component of text mining that performs a special kind of linguistic analysis by deep learning algorithms so a machine can “read” text. Apps like Grammarly or Wordtune analyze text to improve a written text, for example, and chatbots use this technology to interact with customers.
Text mining, or text analytics, is the process of examining big data document collections. It’s a computer science discipline that converts unstructured text data in documents and databases into normalized, structured data and datasets for analysis by machine learning models. Deep learning machine-learning algorithms then analyze this data, analyzing semantics and grammatical structures, to gain new insight or aid research from human language.
Together, NLP and text mining are like a search engine on steroids.
The Consumer Price Index (CPI)
According to this Forbes Advisor article, "The two most frequently cited indexes that calculate the inflation rate in the U.S. are the Consumer Price Index (CPI) and the Personal Consumption Expenditures Price Index (PCE)." For this article, however, we'll only use the Bureau of Labor Statistics (BLS) method of CPI inflation calculation as a reference.
CPI observes a specific group of commonly-purchased goods and services to gauge how prices fluctuate. These foods and services include:
- Apparel: Women's and men's clothes, jewelry, etc.
- Alcoholic beverages: Beers, wine, liquor, etc.
- Energy and commodities: Gasoline, natural gas, electricity, etc.
- Food: Items bought by the average consumer, such as breakfast cereal, milk, meat, fruits, vegetables, etc.
- Housing and shelter: Rent, housing insurance, bedroom furniture, hotel or motel accommodation costs, etc.
- Medical care services: Physicians' services, prescription drugs, medical supplies, etc.
- New and used vehicles: Trucks, vans, sedans, SUVs, etc.
- Tobacco and smoking products: Tobacco-related items, such as cigarettes, cigars, bidis, kreteks, loose tobacco, etc.
- Transportation services: Airline fares, vehicle insurance, etc.
NLP text-mining process: web mentions matched to CPI categories
Using SESAMm's web text analysis engine TextReveal®, we analyzed textual data relating to the inflation topic within the U.S. from 2017 until now. For this analysis, we defined co-mentions as the articles and social media posts that mention "inflation" and at least one of the CPI categories. Note: Although we can analyze more than 100 languages, we focused on English in this case. Also, we didn’t conduct a sentiment analysis from the information extraction.
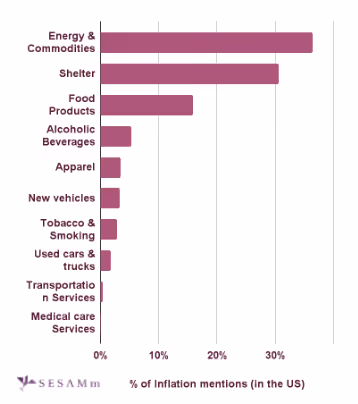
From 2017 to 2019, inflation co-mentions within the U.S. are relatively stable (see Figure 1). But this trend changes with the first shift in 2020, continuing its rapid growth and peak by the end of 2021 due to this surge of inflation reaching record levels.
What was one of the main drivers of the inflation surge? Used cars.
3 used-car and inflation trends uncovered through NLP Text Mining
According to the U.S. Bureau of Labor Statistics, the cost of used vehicles was one of the main drivers of the inflation spike. How did used cars contribute to inflation? The chain of events occurred like so: The increased used-car demand was fueled by a new-vehicle supply shortage caused by a chip shortage generated by supply-chain interruptions due to the COVID-19 pandemic.
As the pandemic-induced supply-chain interruption unfolded, used-car trends developed. Here are three we found in our data mining research:
Trend 1: Co-mentions percentage for used vehicles more than doubled
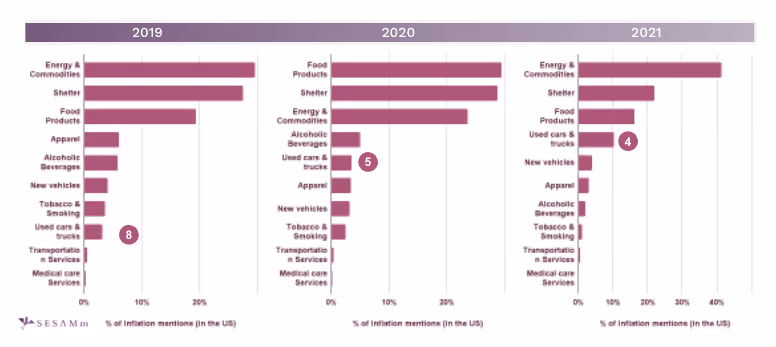
Based on the percentage of co-mentions compared to other topics, the used-car topic moves from the number eight spot to the number four spot in 2021 (see Figure 2).
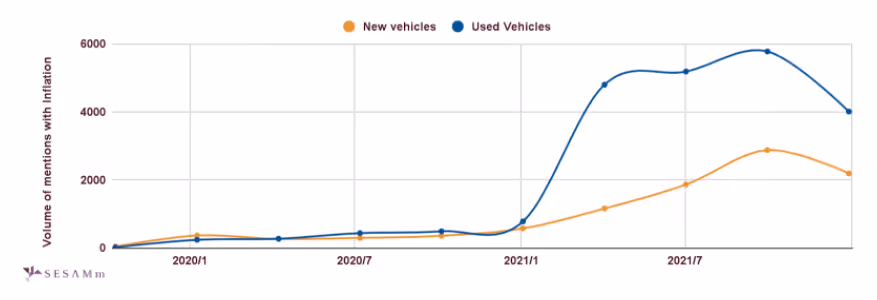
Before 2020, mentions were relatively steady. However, we observe an increase in used-vehicles mentions caused by disruptions in supply chains leading to chip shortages (see Figure 3) as early as January 2020. These shortages led to a decrease in new vehicle inventory. The Statista report, indicating an increase of the used vehicle value index by 49 points compared to the price index recorded in 2020, supports our findings.
Trend 2: Used vehicle prices rose with used-car co-mentions
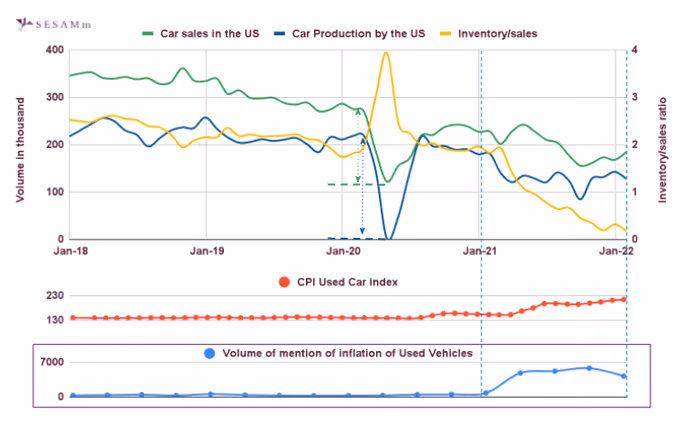
Because of the pandemic, car production nearly stopped along with the sale of cars, which created two situations: 1. high inventory to sales ratio and 2. historically low car production (see Figure 4). Vehicles sales picked up later, but car production was still suffering because of supply-chain disruption. That meant the inventory to sales ratio dropped to virtually zero.
So consumers with little-to-no options for new vehicles turned to used cars, increasing their demand and therefore increasing their prices. We confirm this hypothesis with increasing mentions within the used-vehicles topic, coinciding with an inventory volume decrease. All in all, used-vehicle prices rose 40.5%.
Trend 3: The COVID-19 pandemic and new vehicle inventory shortage increased demand
A smaller new-vehicle inventory wasn't the only reason consumers sought out used vehicles. They also wanted used cars because of the pandemic.

For 2020, we observe that consumers avoided public transportation by rising co-mentions between pandemic-related mentions and the demand for secondhand vehicles (see Figure 5).
Used-car and inflation trends summary
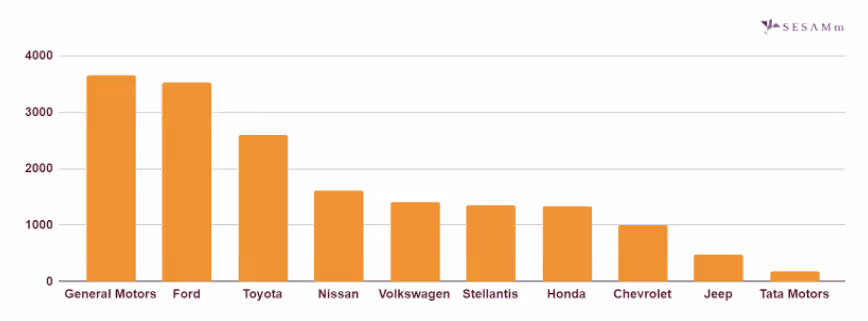
We can summarize the used-car and inflation trends with one phrase: It's a used-car seller's market. For example, online retailers like Carvana have leveraged these factors to grow significantly. In contrast, due mainly to significant supply chain disruptions, motor companies have had the opposite effect, with the Automotive industry projected to lose $210 Billion. Judging by the number of mentions in public web forums and social media, the chip shortage and used-car boom affected General Motors, Ford, and Toyota the most (see Figure 6).
About SESAMm and TextReveal’s® NLP Text-mining Capabilities
SESAMm is a leading company in alternative data and artificial intelligence, delivering global investment firms and corporations descriptive, prescriptive, or predictive investment analytics worldwide. TextReveal is SESAMm's premiere NLP text-mining product, a solution that allows you to fully leverage NLP-driven insights and receive high-quality results through data streams, modular API and dashboard visualization, and signals and alerts. In other words, we organize, categorize, and capture relevant information from raw data for you.
READ MORE: Check out "Alternative Data Trends – How Reddit Helped Fuel The Great Resignation."
Ready to uncover the invisible data about your investments and target companies? Request a TextReveal demo today.


.png)