The EU’s Corporate Sustainability Reporting Directive (CSRD) promised a new era of transparency and comparability in sustainability reporting. But as the first wave of CSRD-aligned reports emerges in 2025, the reality is proving more complex. Some companies are racing ahead with detailed disclosures, while others are taking a minimalist approach. Investors? Many are struggling to make sense of it all.
We’re only at the beginning of the CSRD journey, but the early lessons are already clear: The gap between reporting ambition and data quality is widening. And the path forward may be shaped as much by simplification as by regulation.
Early CSRD Reporting: A Diverse Landscape Takes Shape
Since early 2025, over 250 companies have published sustainability reports aligned with CSRD — with report lengths ranging from 30 pages to over 300. One striking takeaway: The number of sustainability-related Impacts, Risks, and Opportunities (IROs) disclosed varies dramatically. Some companies report on fewer than 15 IROs. Others disclose more than 80. This variation highlights not only the complexity of CSRD implementation but also differences in how companies interpret their reporting obligations — and their readiness to meet them.
A PwC analysis shows that 90% of the first 100 CSRD reports came from just five European countries, including Germany, Spain, and the Netherlands, none of which have yet transposed CSRD into national law. Why report early? The answer is clear: mounting pressure from investors, regulators, and other stakeholders demanding greater transparency on sustainability performance.
But just as the first reports hit the market, uncertainty looms. The European Commission’s February Omnibus package could remove up to 80% of companies from the directive’s scope — a move that may significantly reshape the reporting landscape.
Data Quality: The New Focus Area for Reporting and Investors
At the heart of CSRD reporting lies the double materiality assessment, a process that requires companies to disclose sustainability matters that affect both enterprise value and broader environmental and social impacts. But execution varies widely.
According to PwC, while nearly all companies engage with internal stakeholders during the materiality process, few provide detailed information about engagement with external stakeholders.
The most commonly reported topics include:
Climate Change (mitigation, adaptation, energy use)
Business Conduct (ethics, anti-corruption measures)
As PwC notes, the goal is to help companies and stakeholders “understand more clearly the interplay between sustainability and value creation.” But when reporting approaches differ so dramatically, comparison becomes difficult, leaving investors to navigate a patchwork of methodologies and disclosures.
Sondre Myge, head of ESG at Skagen Funds, said that while it’s still early, his “first impression is that it complicates comparability. Investors are now drowning in a mix of voluntary and legal disclosures requiring them to make assessments through a kaleidoscope of standards and methodologies. Sifting critically through hundreds of pages of text just for one company is a huge undertaking. While first movers will provide glossy reports that convey a convincing impression, it is important to remember that disclosures are not necessarily representative.”
Jan Kaeraa Rasmussen, head of ESG and sustainability at PensionDanmark, agreed, stating that initial disclosures tend to be “more narrative than quantitative. This limits our ability to draw robust, forward-looking insights from the information provided.”
What’s Next: Simplification or More Complexity?
Despite these challenges, the direction of travel is clear: sustainability reporting in the EU is becoming more structured, more transparent, and more data-driven. But we are still in a period of transition.
Companies are building internal systems and capabilities to support CSRD compliance. Best practices are only now emerging. And regulatory changes, like the proposed Omnibus package, could dramatically alter the scope of reporting obligations.
For investors and stakeholders, the challenge will be to sift through early reports critically, distinguishing between narrative-heavy disclosures and data-rich insights that can drive better decision-making.
How SESAMm Helps Investors Navigate ESG Data Complexity
As sustainability reporting evolves, so too does the need for faster, more scalable ways to uncover ESG and reputational risks. At SESAMm, we help investors and companies cut through the noise.
Using advanced Generative AI, we automate ESG monitoring and due diligence on public and private assets — providing real-time coverage of over 5 million companies globally. Leading firms like Carlyle, Warburg, Natixis, RBI, Fitch, and Oddo trust SESAMm to uncover risks in seconds, not weeks.
Discover unparalleled insights into ESG controversies, risks, and opportunities across industries. Learn more about how SESAMm can help you analyze millions of private and public companies using AI-powered text analysis tools.
Researching and analyzing investment opportunities can be challenging for asset management—private equity and hedge fund portfolio managers, researchers, and analysts—because, of course, you want to make sure that you're a good steward of your client's investments.
And when you find and source data, such as traditional or alternative data, you also want to make sure it's reliable and that the methods used to gather it are tried and true.
This article aims to give you an inside look into SESAMm's knowledge graph—one of the key reasons SESAMm's NLP-derived alternative data is reliable and trusted. We'll explain what a knowledge graph is, why it's important, how it works, and what makes SESAMm's knowledge graph unique.
What is a knowledge graph?
A knowledge graph is a digital representation of a network of real-world entities, the foundation of a search engine or question-answering service. This structured data model puts the schema in context through linking and semantic metadata, providing a framework for data integration, analytics, unification, and sharing. In other words, it's like a map and legend, with the legend labeling the concepts, entities, and events and the map connecting and identifying their relationships. These details are stored in a graph database and visualized as a graph representation, hence the term knowledge graph.
Fun fact: The expression, knowledge graph, gained popularity after Google used it in 2012 to name their semantic network.
Two types of knowledge graphs
There are two general types of knowledge graphs: open and private. Open knowledge graphs are open to the public. They're created and made available by organizations such as Wikidata, DBpedia, and Yago. Private knowledge graphs are often only used by organizations that create them, like Google, WolframAlpha, Facebook, and SESAMm (of course). Some offer them up for a fee or subscription, such as Crunchbase and OpenCorporates.
Why a knowledge graph is important
Knowledge graphs are important because they equip us with a model to see how everything relates from a big-picture view, creating new knowledge. Its benefits include:
Incorporating disparate data sources, avoiding data silos
From a data science and artificial intelligence (AI) perspective, knowledge graphs provide machine-readable details, adding context and depth to data-driven AI techniques such as machine learning. Using knowledge graphs and machine learning models together improves system accuracy and extends the range of machine learning capabilities for better explainability and trustworthiness.
How a knowledge graph works
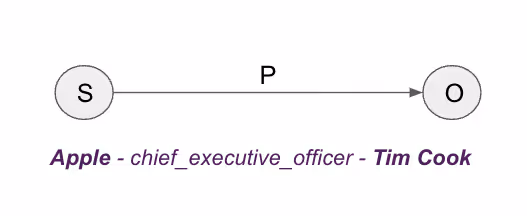
The core of a knowledge graph is its knowledge model, a collection of interconnected descriptions of concepts, entities, events, and relationships known as an ontology. This model provides a framework for statements or taxonomy. Each statement consists of a subject, predicate, and object (Figure 1)—known as a triple model—and each subject or object is represented only once in the context of the other subjects and their relationships. For example, in this simple sentence, "The boy kicks the ball," The boy is the subject, and kicker is the predicate because he kicks the ball, the object.
Figure1: Apple is the subject, chief executive officer is the predicate, and Tim Cook is the object.
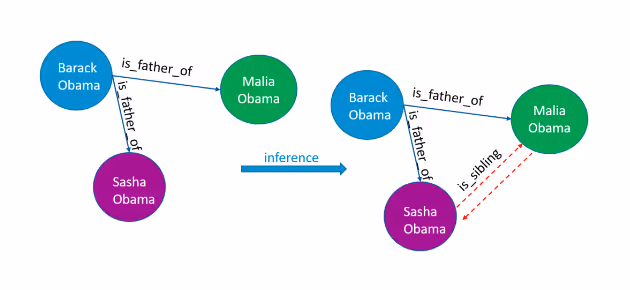
Likewise, each statement consists of three components: nodes, edges, and labels. A node, or vertice, represents an entity, which can be anything existing in the real world, such as a person, company, or object. For instance, in this example (Figure 2), Barack Obama is the subject node, Malia and Sasha are object nodes, and the edges, or relationships, are labeled as father or sibling, respectively.
Figure 2: How the relationships between nodes can be labeled.
What makes SESAMm's knowledge graph unique?
SESAMm uses open and private datasets with custom, curated information to create our proprietary knowledge graph. As a result, the knowledge graph is a vast map connecting and integrating over 70 million related entities and their keywords, relating each organization to its brands, products, associated executives, names, nicknames, and exchange identifiers in the case of public companies from a data repository made up of more than 18 billion articles and messages and growing.
The knowledge graph is updated regularly
Entities within the knowledge graph are updated weekly and tagged to ensure we correctly track their changes. For instance, the CEO of a company today might not be its CEO tomorrow. And brands might be bought and sold, changing the parent company with each sale. So, weekly updates within the knowledge graph ensure the system is aware of these changes.
NLP-driven accuracy
At SESAMm, named entity disambiguation (NED), a natural language processing (NLP) technique, identifies named entities based on their context and usage. Text referencing "Elon," for example, could refer indirectly to Tesla through its CEO or to a university in North Carolina. Only the context allows us to differentiate, and NED considers that context when classifying entities. This method is superior to simple pattern matching, which limits the number of possible matches, requires frequent manual adjustments, and can't distinguish homophones.
SESAMm uses three other NLP tools to identify entities and create actionable insights: lemmatization, embeddings, and similarity. The lemmatization process normalizes a word into its base form (morphology) to help identify and aggregate entities. Embedding assigns the entity a numerical value to help analyze how words change meaning depending on context and understand the subtle differences between words that refer to the same concept. Similarity measures whether two words, sentences, or objects are close to one another in meaning.
SESAMm tailored its knowledge graph to find, extract, and analyze data about public or private entities, which isn't readily available from the web or standard rating firms. This unique implementation of a knowledge graph provides insights to give you an edge when researching, analyzing, and submitting recommendations to the portfolio manager or clients.
SESAMm's premiere platform, TextReveal®, allows you to leverage NLP-driven insights fully and receive high-quality results through data streams, modular API and dashboard visualization, and signals and alerts. It's perfect for many quantitative, quantamental, and ESG investment use cases.
Learn how SESAMm can support you in your investment decision-making and request a demo today.
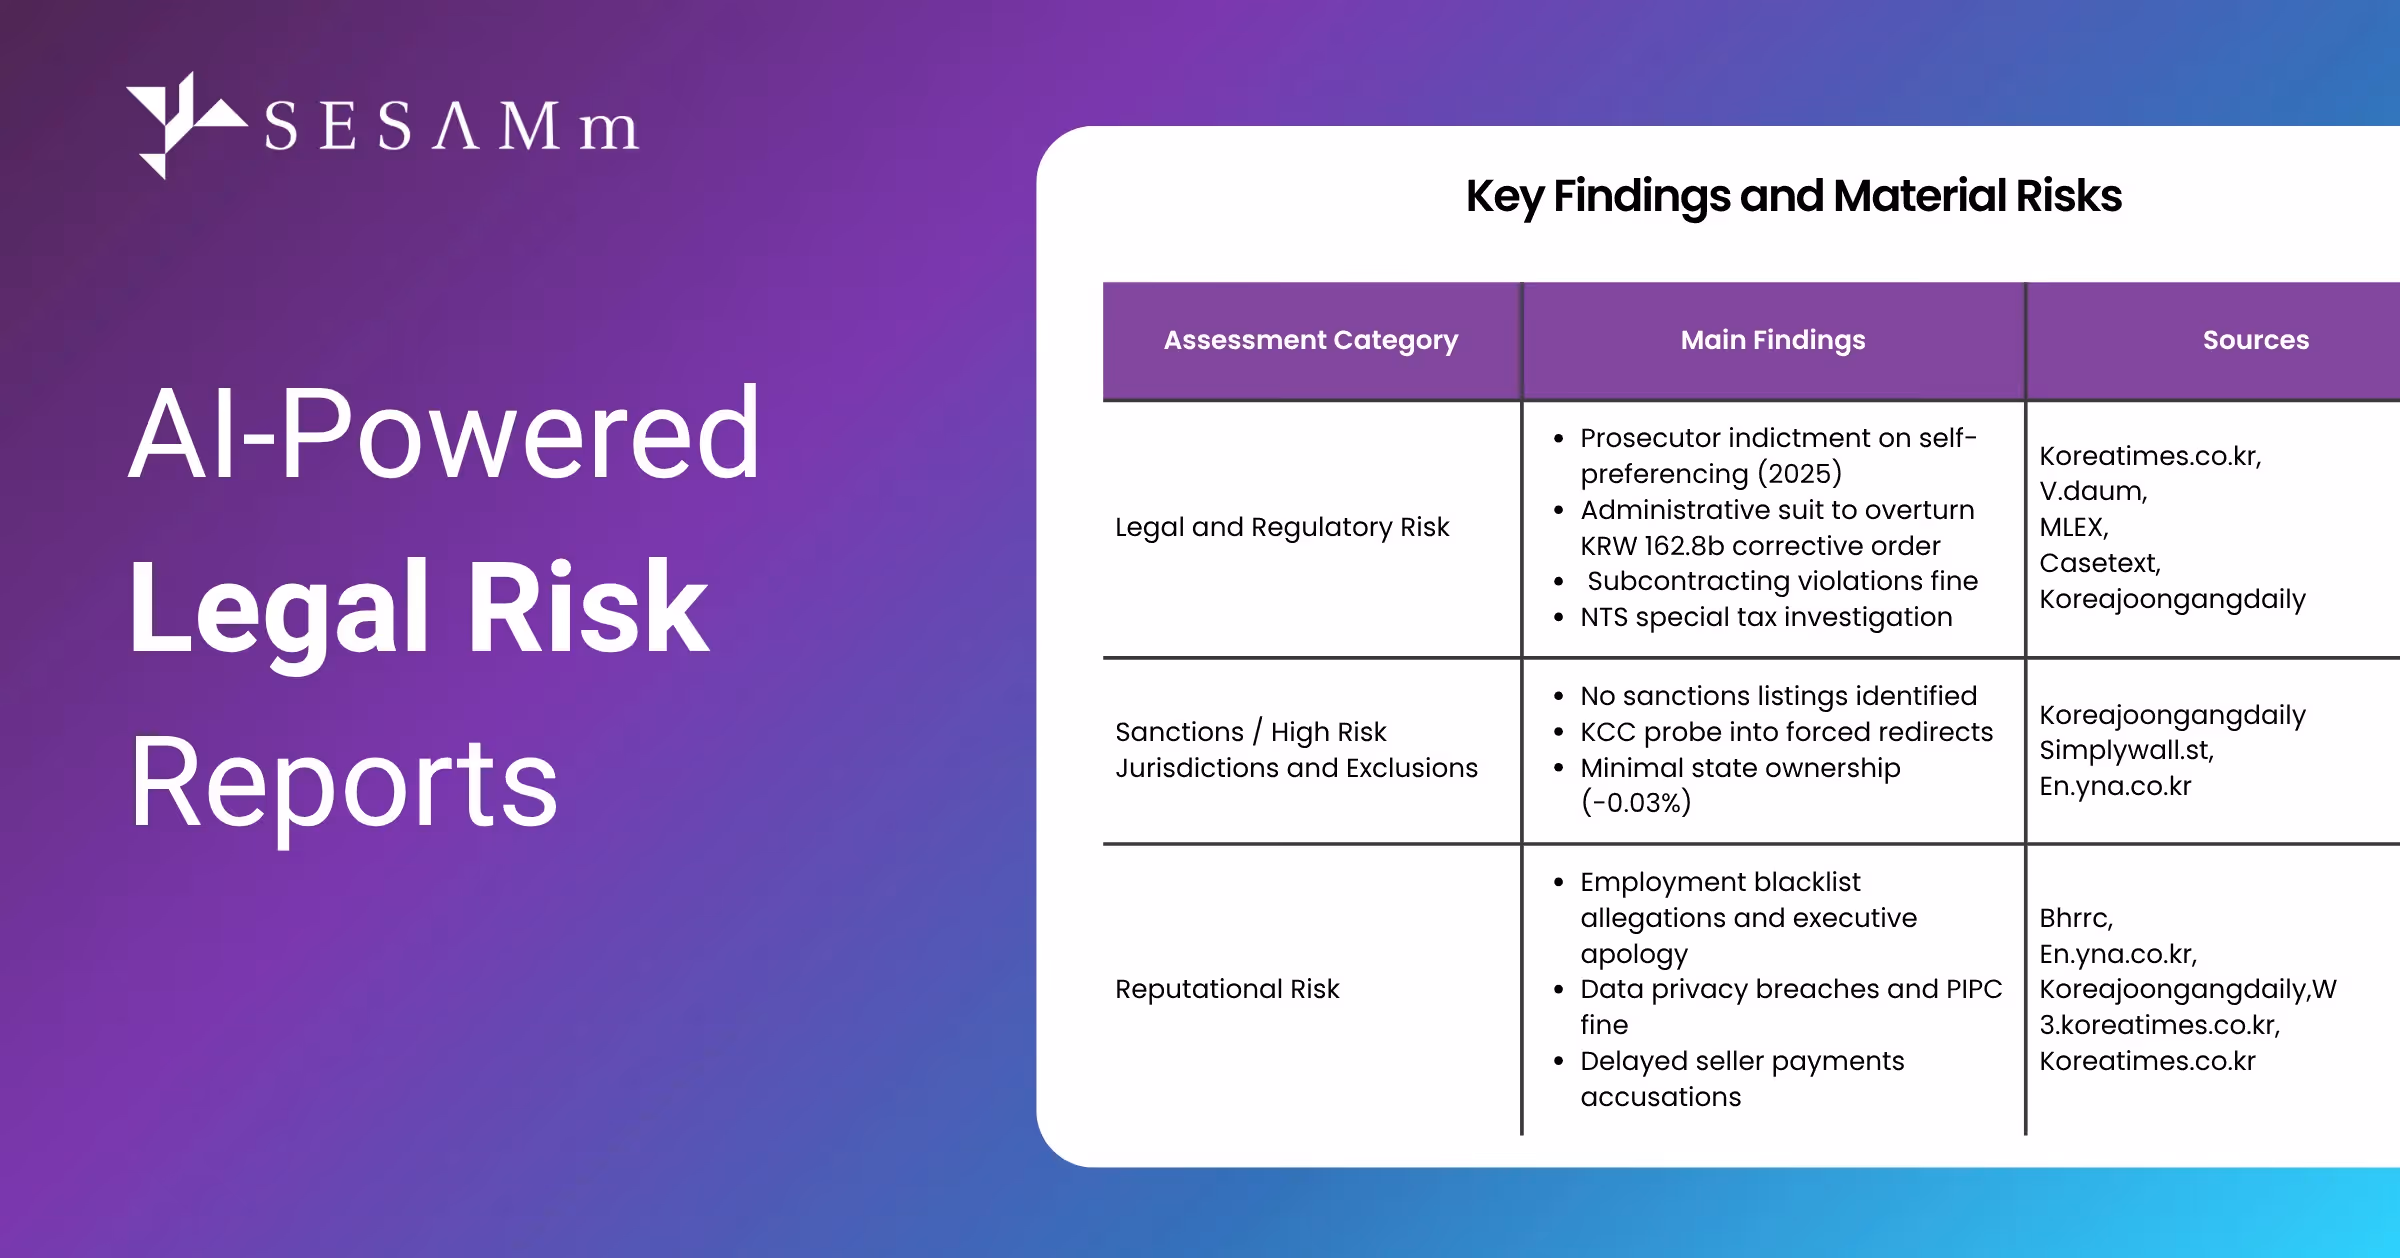
Following the success of SESAMm’s AI-Powered Deal Screening Reports, we’re expanding our due diligence suite with a new addition: the AI-Powered Legal Risk Report. Built for private equity, M&A, and legal teams, it delivers a rapid, data-driven view of a company’s litigation, regulatory, reputational exposure and all public compliance documentation and disclosures, helping professionals identify red flags early and make faster, more informed decisions.
Accelerating Legal Due Diligence
In private equity transactions, time is limited but the stakes are high. Traditional legal research can take weeks of reviewing court filings, disclosures, and media coverage. SESAMm’s Legal Risk Report automates this process, scanning millions of documents to surface potential risks in less than an hour.
Each report is generated automatically in less than 15 minutes and backed by verifiable sources, giving legal and compliance teams the transparency they need to validate findings and support defensible due diligence.
The Legal Risk Report helps professionals accelerate and strengthen their assessments at every stage of a transaction:
Reduce blind spots: Uncover litigation, compliance, or reputational issues that manual research might miss.
Strengthen documentation: Support client memos and audit findings with verifiable, AI-extracted evidence.
Reduce costs and time: Cut research hours while maintaining defensible, high-quality standards.
SESAMm’s technology is trusted by leading financial institutions to enhance their understanding of ESG, reputational, and regulatory risks. The new Legal Risk Report builds on this foundation, extending SESAMm’s AI capabilities to help law firms, compliance officers, and corporate legal teams uncover litigation and reputational exposures with speed and transparency.
By combining AI-powered text analysis with structured risk categorization, SESAMm enables professionals to go from question to insight - and from risk to response - faster than ever.
Stay ahead with the latest in ESG and AI intelligence
Join our mailing list to receive new reports, event invites, and updates from SESAMm directly to your inbox.


.avif)


.png)