Webinar Replay: Sustainability Advantage or Burden
07/17/2025
•
5 mins read
As regulatory demands grow and ESG expectations evolve, financial institutions face a critical question: Is sustainability compliance merely a cost center or can it drive measurable financial and competitive advantages?
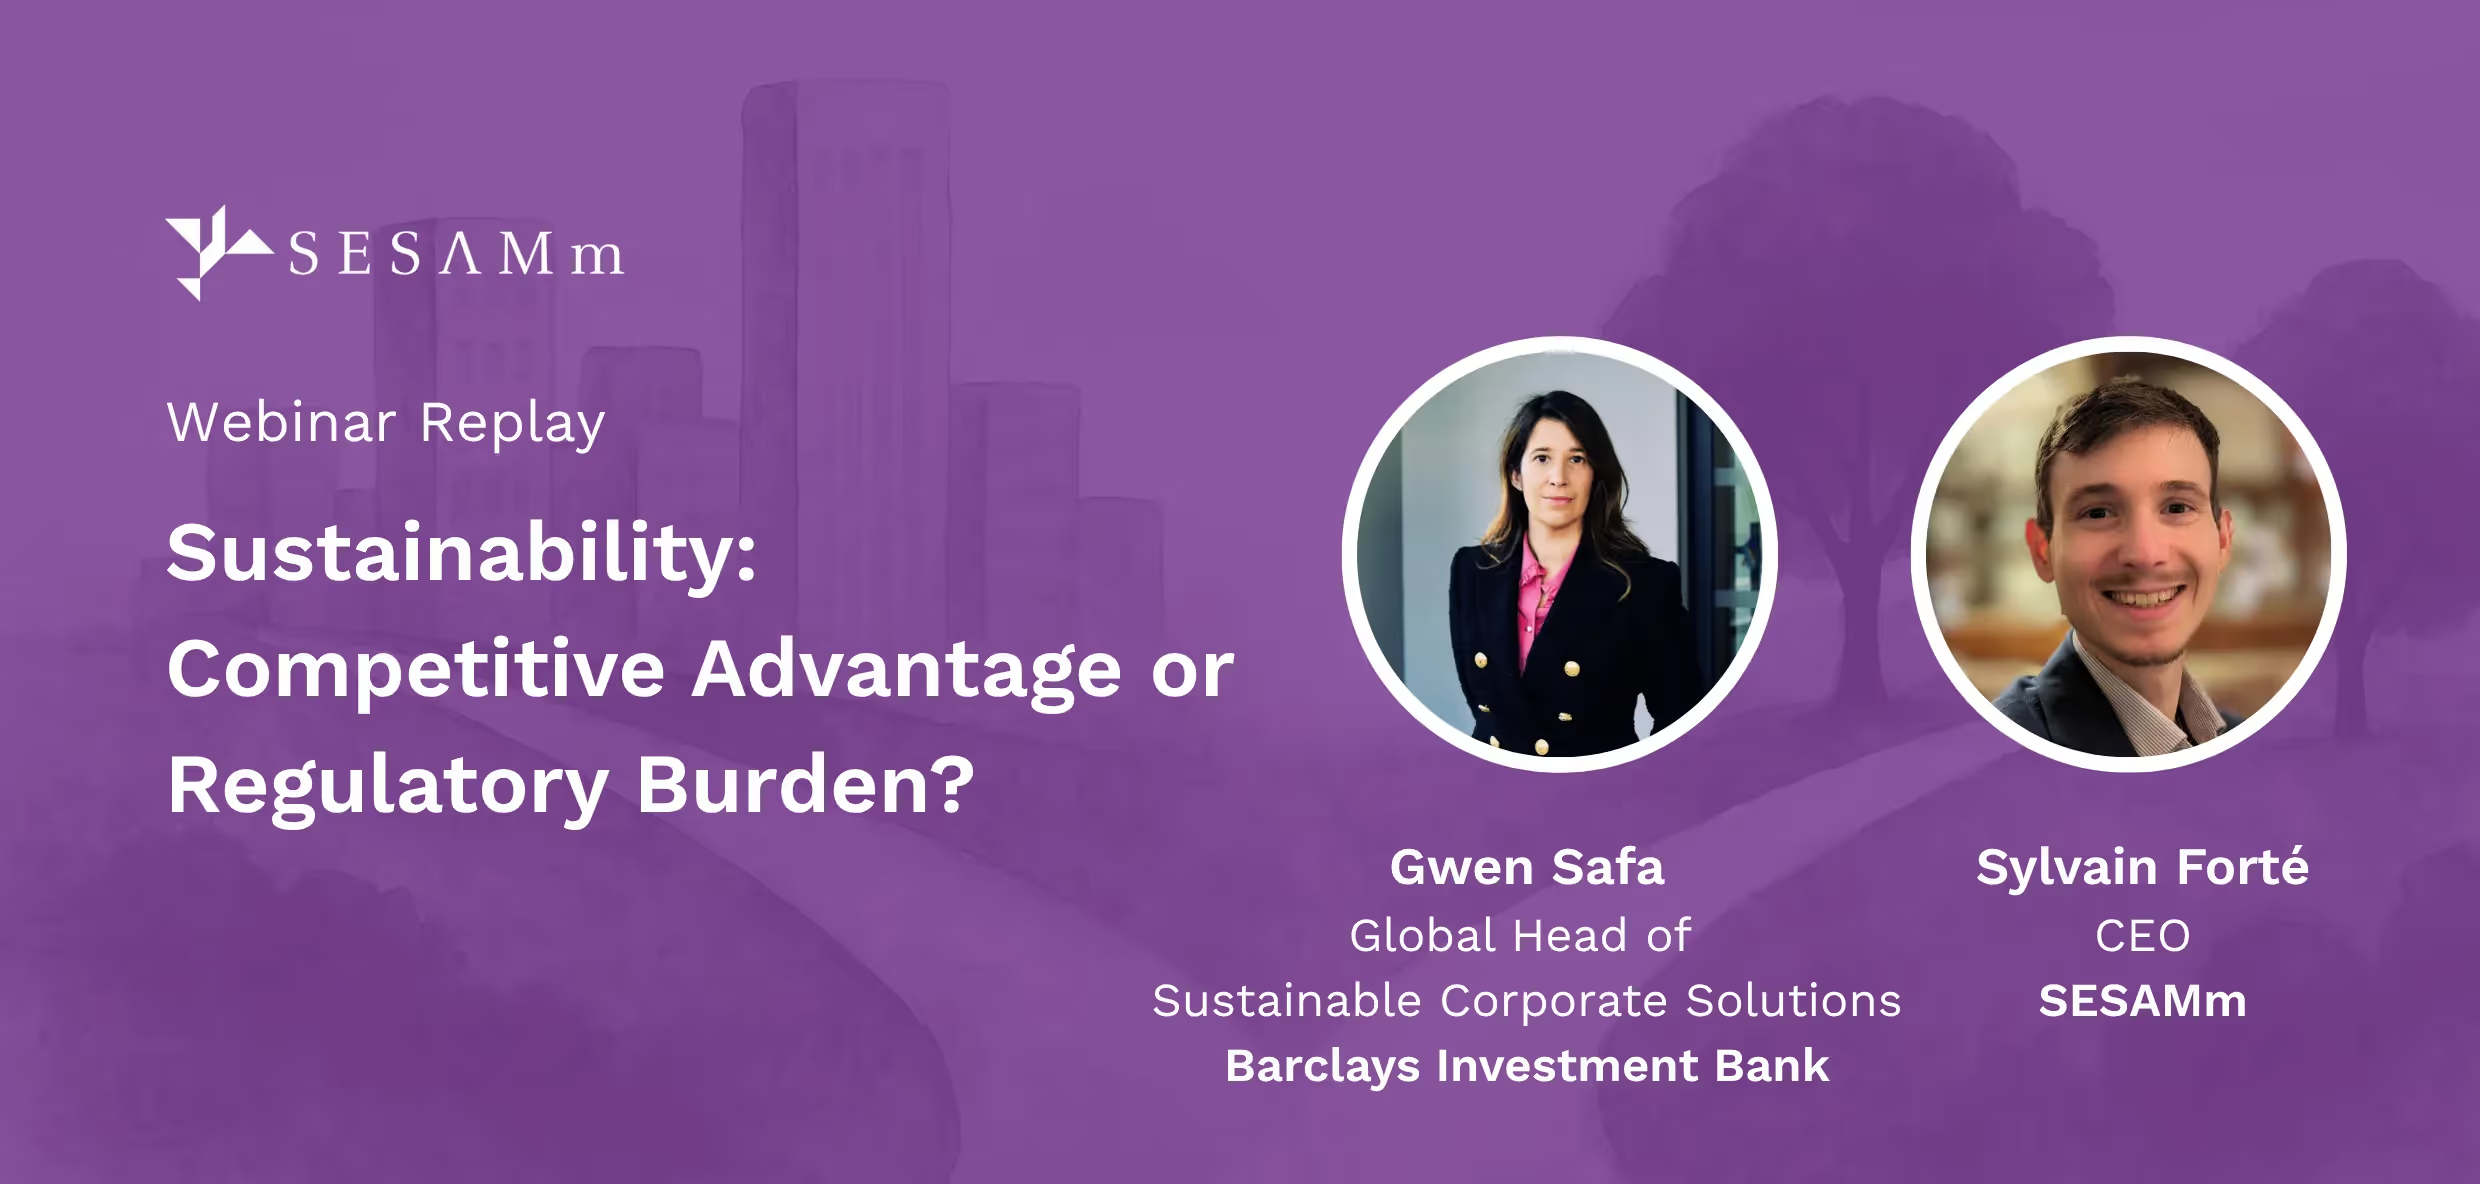
Watch this on-demand webinar to hear Gwen Safa, Global Head of Sustainable Corporate Solutions at Barclays Investment Bank, and Sylvain Forté, CEO of SESAMm, offer actionable insights on transforming ESG challenges into strategic opportunities.
Together, they unpack:
Why leading firms are reframing ESG as a value driver, not just a regulatory obligation
How to navigate the ESG backlash while staying aligned with long-term investor and stakeholder expectations
Where ESG meets reputational risk and why both are critical to financial performance and trust
Whether you're managing risk, sourcing deals, or building client trust, this session offers a candid look at the shifting role of ESG and what it means for the future of finance.
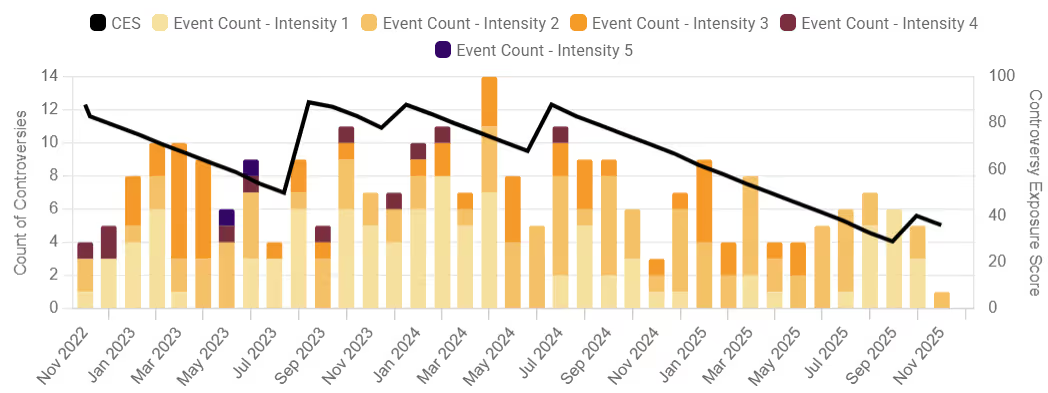
The ESG landscape for U.S. private equity firms is increasingly defined by systemic governance pressure and rising social and environmental scrutiny. Governance issues at firms such as Blackstone, KKR, Thoma Bravo, TPG, and Francisco Partners primarily focus on deal processes, disclosure practices, and investor protection. These concerns encompass settlements related to pension mismanagement, actions taken by the Department of Justice regarding pre-merger filings, as well as lawsuits and shareholder investigations examining the fairness of take-private transactions and stock buybacks. On the social side, exposure is driven largely by portfolio companies and political positioning. Housing and tenant-rights disputes sit alongside allegations of labor abuses, child labor, and unsafe conditions. Environmental concerns are increasingly prominent, with major companies facing criticism for their exposure to fossil fuels, their impact on climate change, and associated lobbying efforts.
What are the most pressing ESG challenges currently facing the U.S. private equity firms? Read on to find out.
Blackstone: Governance Pressure, Social Backlash, and Climate Criticism
Blackstone is facing a wide range of ESG controversies. Governance challenges include a $227.5 million settlement related to Kentucky pension mismanagement, a $590 million lawsuit involving SPAC Recovery Co. that alleges a fraudulent scheme, and SEC fines tied to off-channel communications failures. On the social front, the firm has drawn criticism for political spending that heavily favors right-leaning candidates, child-labor incidents, and recurring safety violations at portfolio companies. Housing-related concerns also persist, with tenant protests over rent and eviction practices and university movements calling for divestment from Blackstone-linked real estate funds. Environmentally, Blackstone continues to be targeted by climate activists for its fossil fuel exposure and its perceived contribution to escalating climate risks.
TextReveal’s web data analysis of over five million public and private companies is essential for keeping tabs on ESG investment risks. To learn more about how you can analyze web data or to request a demo, reach out to one of our representatives.
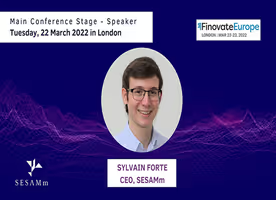
Finovate Europe invites a selection of European Fintech leaders to discuss and showcase the latest technology innovations and trends in the industry. CEO Sylvian Forté will demonstrate SESAMm’s latest innovation TextReveal® Streams, at the event, live on the main stage. Streams is a ready-to-use alternative dataset. It provides daily sentiment analysis and ESG data mapped to public and private firms leveraging SESAMm’s NLP (Natural Language Processing) powered engine to fuel investment strategies.
SESAMm owns a proprietary 13 years historical data lake containing over 17 billion articles publicly sourced from more than 4 million sources (blogs, forums, social networks, etc.). This represents 10 to 100 times more information than that of our competitors. SESAMm works with Hedge Funds, Private Equity, and other financial firms to help them generate alpha, gather exclusive insights, and tailor unique analytics.
Join us with over 1000 senior attendees, 50+ demoers including SESAMm and its CEO Sylvain Forté, and 70+ insightful speakers. In addition to demonstrating our latest innovation on stage, our team will also be available to perform 1:1 demos in the exhibit hall area. If you’re attending the event, stop by to say hi!!
SESAMm is proud to announce the launch of our latest solution: TextReveal® ESG Alerts. TextReveal ESG Alerts identifies ESG risks1 and positive impact coverage2 in over 100 languages by tracking mentions of your entire portfolio across 20 billion historical articles with millions of new ones added daily in near real-time.
1 Inspired by SASB and other major standards. 2 Based on UN SDGs.
Why use TextReveal ESG Alerts for your portfolio
Environmental, social, and governance (ESG) ratings have become a conventional measure of a company’s risk against those business areas. They are also increasingly critical as legislation and stakeholders focus on sustainability, positive impact initiatives, and corporate social responsibility (CSR). So with the practice of ESG rating, investors have been able to use those scores to make decisions about their portfolios. Of course, investors are committed to a greener future, too.
Unfortunately, traditional ESG ratings come with challenges. For example, according to Andrew McLaughlin, a contributor to The Globe and Mail, many ESG rating providers are “popping up like dandelions,” and “each uses its own methodologies to rank and score publicly traded companies based on their purported environmental, social and governance risk and performance.” Further, you might have access to ratings, but they’re only updated once per quarter or once yearly.
With SESAMm’s TextReveal ESG Alerts, you can access consistent, timely daily data on five million public and private companies to better assess risks and receive early warnings.
Figure 1: In 2020, U.S. news sentiment falls ahead of the stock market in response to COVID-19 concerns.
The model can calculate sentiment for each company by analyzing the news of individual companies. It’s also possible to create a composite to measure the sentiment related to a stock index. The sentiment data also helps management and investor relations because it provides a quantitative means of understanding the extent to which investors are concerned about certain news about their company.
Verifying the results
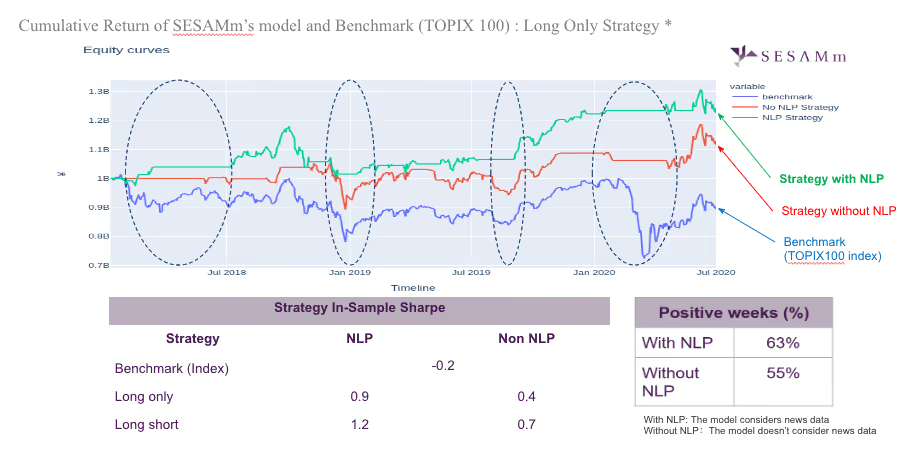
Verification using Japanese has revealed that the timing of bottoming and ceiling of text sentiment precedes those of stock prices. The collaborating team compared the performance of:
A model that uses only orthodox financial and economic data as inputs
A model that considers NLP and financial and economic data, confirming that the latter could generate higher alpha
ESG controversy monitoring can alert you to potential risks before market-moving events occur. Illustrated: Tesla ESG scores for pollutants, ethical standards, discrimination, and environmental impact.
The TextReveal ESG Alerts edge
Broad coverage
Access five million private and public companies of all sizes, including micro-caps, to identify risks in over 100 languages.
Expertise
Leverage ninety pre-built yet taxonomy-adaptable ESG risk categories such as SASB standards, UN Global Compact, and UN SDG-based positive impact statistics coverage.
Transparency
Gain insights with deeper analysis, seeing specific articles driving your alerts.
Timeliness
View live web data for forward-looking scores and insights.
TextReveal ESG Alerts features
Because we trained them on a representative corpus selected from billions of articles from prestigious news organizations, local news, and discussion forums, our NLP tools can understand finance and interpret slang, misspellings, and textspeak.
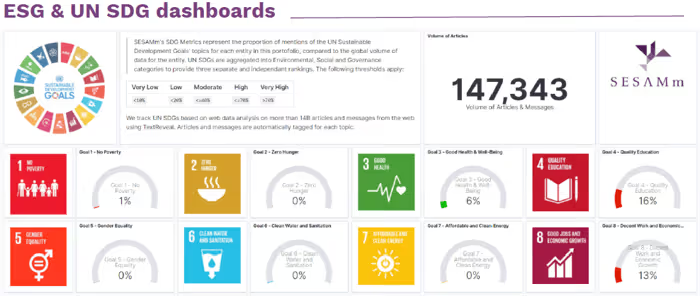
Get an ESG and UN SDG dashboard view of your portfolio.
The best part is that you can receive alerts and monitor scores in the way that works best for you. ESG and UN SDG‐based positive impact statistics can be accessed and delivered via:
Email Alerts
CRM and cloud based integration
Live dashboards
API and data files
ESG studies
Get the SESAMm edge from TextReveal ESG Alerts
Save time vetting your current investments and evaluating new ones while providing higher quality, objective results compared with manual monitoring, black-box ratings, or self-reported questionnaires.
Reach out to a SESAMm representative for a personal demo today.
Stay ahead with the latest in ESG and AI intelligence
Join our mailing list to receive new reports, event invites, and updates from SESAMm directly to your inbox.








.png)