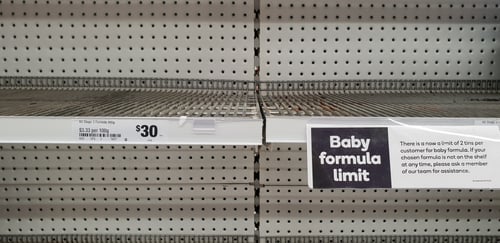
Imagine finding out you've run out of milk immediately after pouring a bowl of cereal. Or maybe realizing you don't have eggs while in the middle of baking a cake. We've all been there, and it's frustrating, to say the least. And this scene has been playing around the globe over the last couple of years for many foods and products. One day it's microchip shortages, and the next, it's baby formula.
Unfortunate as it is, it's one thing for consumers to cope with an empty car lot because of chip shortages. It's another to cope with a hungry infant because store shelves that once contained baby formula are now bare. For those parents and caretakers, their emotions are beyond feeling frustrated. They feel anger and panic, the sort of emotions that they share with their friends and colleagues on social media and forums. The kind of expression that can change the public's sentiment about a company, which in turn can move markets.
This Alternative Data Trends post will examine web data concerning the baby formula shortage. We'll analyze articles, social media, and forum conversations culminating in the U.S. crisis as the news reaches national exposure. We'll also highlight red flags investors could've seen had they monitored the situation with an AI-powered text analysis tool like SESAMm's TextReveal®.
Early warnings: When baby formula supplies began to run dry vs. when it became a national crisis
If we compare absolute and relative volumes—relative being mentions about the topic compared to our entire data lake—the term "formula milk market" yields parallel results. Mentions spike in May when the crisis reaches national coverage (see Figure 1).
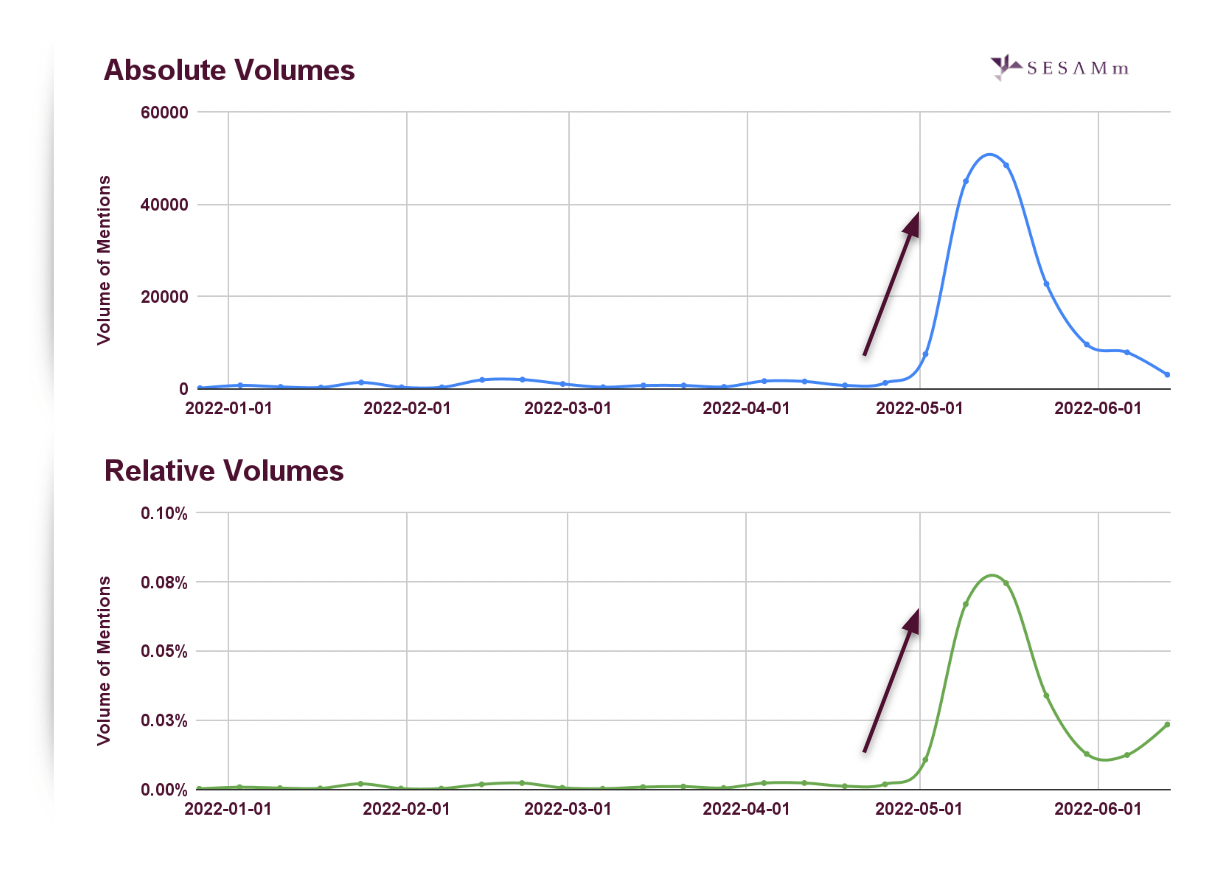 Figure 1: Absolute and relative mention volumes for “formula milk market” match.
However, comparing absolute and relative volumes for the term "formula milk shortage," we find red flags as early as January 2022, four months before the crisis receives national attention (see Figure 2). Relative mentions spike on three occasions before absolute volumes register any significant noise. The fourth instance matches a ripple on the absolute chart.
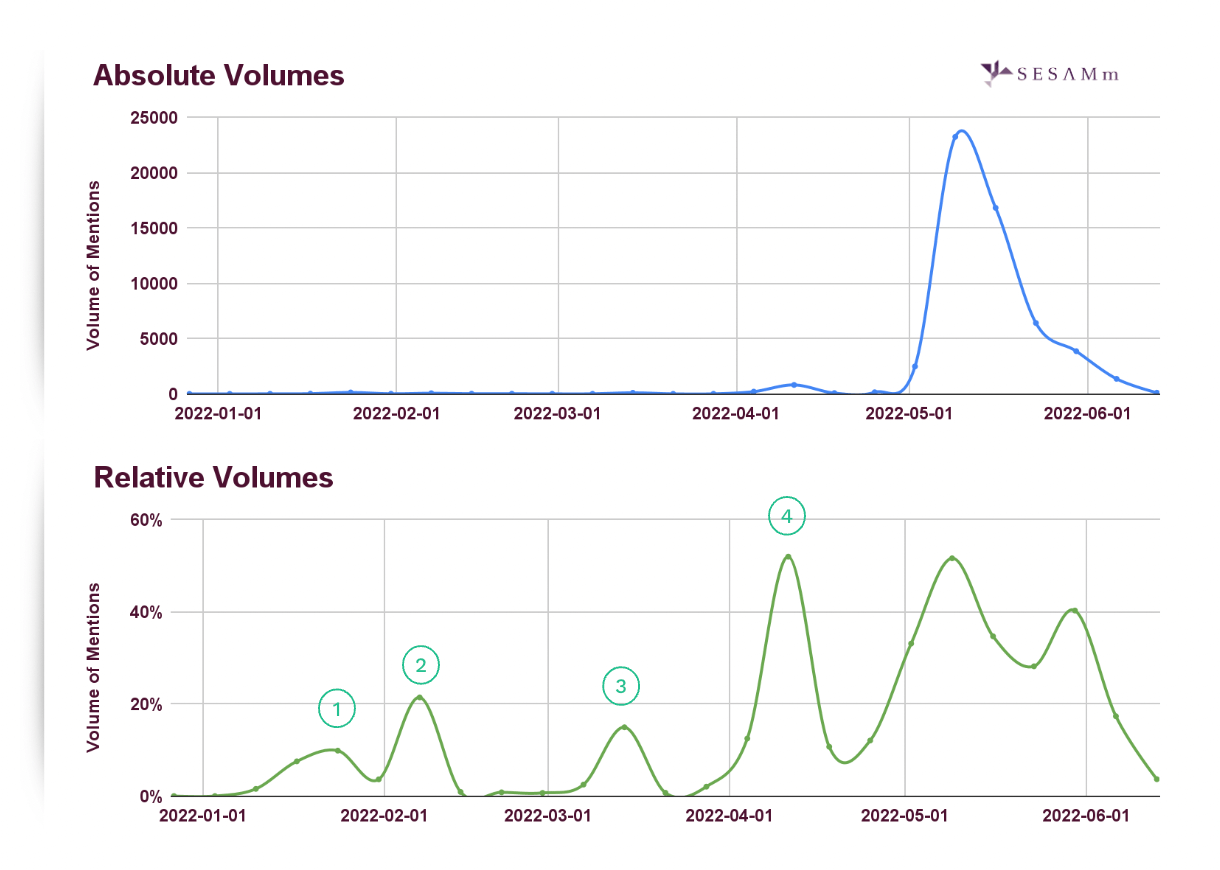
Figure 2: Relative mention volumes for “formula milk shortage” show possible controversies.
These articles provide an example of the content published around the times of those rises in mentions:
- Jan. 12, 2022: "Baby Formula Is Hard to Find. Brands and Stores Are Divided Over Why.," WSJ
- Feb. 9, 2022: "Baby formula shortage has some families scrambling," WCAX-CBS
- Mar. 7, 2022: "Baby formula shortage and recalls affecting families," KGUN-ABC
- Apr. 11, 2022: "A shortage of baby formula is worsening and causing some stores to limit sales," WHYY-PBS
Analyzing the sentiment and polarity of the formula milk market
In short, the e-reputation of the formula milk market has been negative since the beginning of 2022 (see Figure 3). Positive sentiment drops and reflects the opposing negative sentiment almost exactly until May, when the news about the crisis breaks. Likewise, polarity trends downward over the same period.
Note: Polarity represents a company's aggregate of positive and negative sentiment (opinions, reviews), ranging from -1 to 1. A zero score means that there is as much positive as negative sentiment. High e-reputation brands can have polarity scores of more than 0.5.
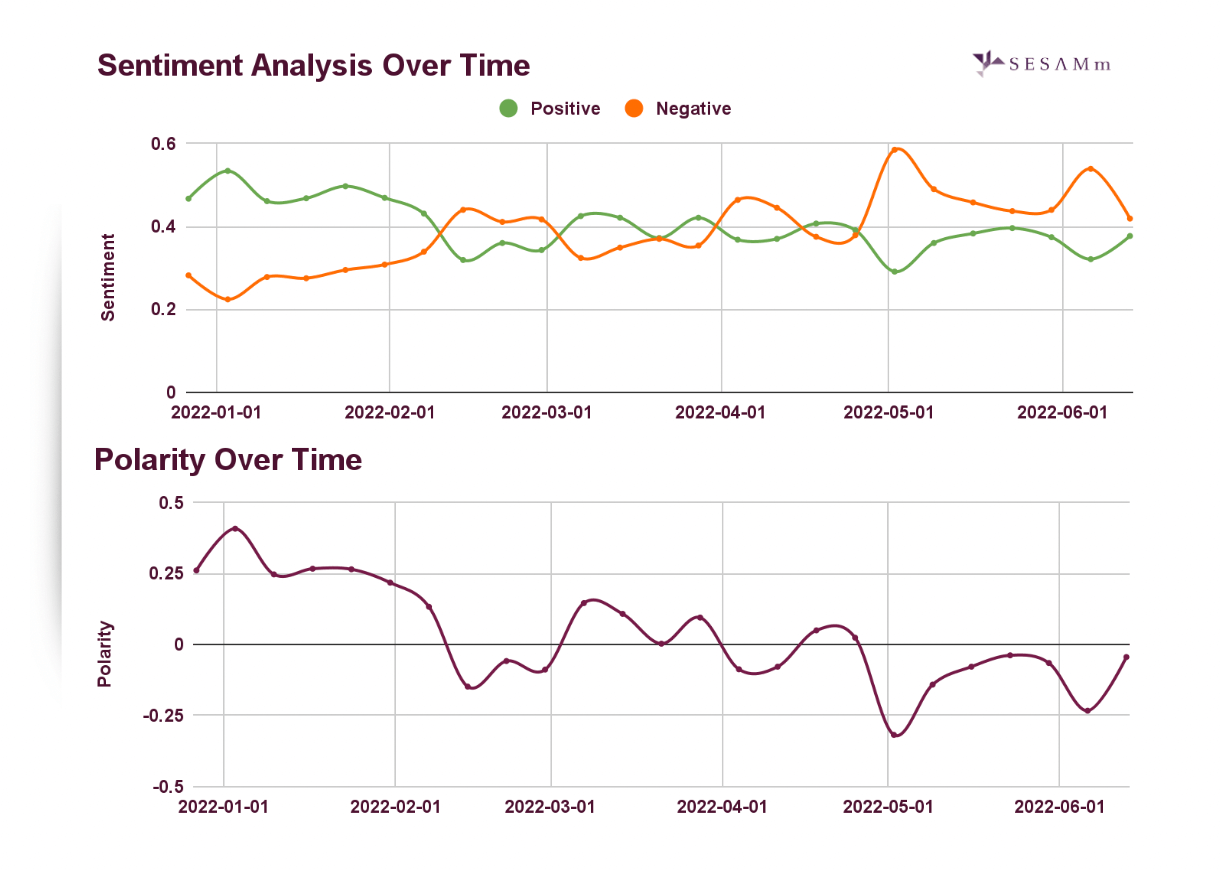 Figure 3: “Formula milk market” sentiment analysis and polarity moved negatively over time
The web data shows that some articles correlate with sentiment and polarity changes. For instance, in February, AboutLawsuits.com posted, "Similac and Enfamil Baby Formula Shortages Create Infant Feeding Challenges." And in May, HealthDay, a prominent syndicator of health news, posts, "U.S. Baby Formula Shortage Worsens."
Analyzing formula milk brands
In the U.S., four brands produce the bulk of formula milk: Abbott, Mead Johnson, Nestlé, and Perrigo. Abbott and Nestlé hold the largest share of the formula milk market.
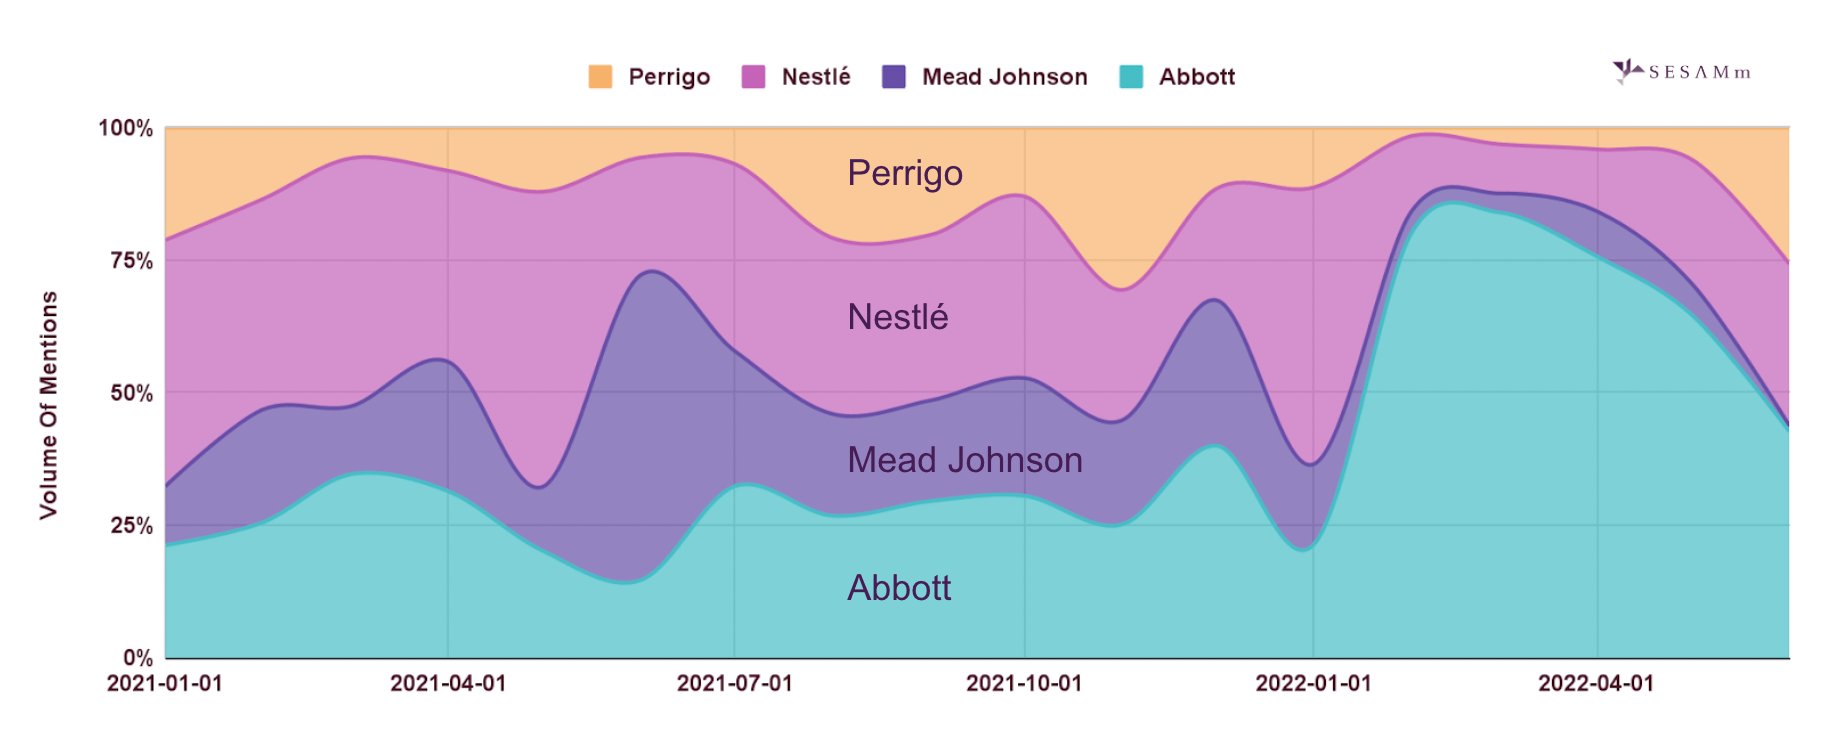
Figure 4: Abbott gains more than 75% of mention volume share in Q1 2022.
When we group these four brands' mentions from January 2021 to June 2022, we can see how their mention volumes compare (Figure 4). For example, at the beginning of the graph, we can see that Abbott and Nestlé have more mention-volume relative to their market share. However, at the end of 2021, Mead Johnson and Abbott experience spikes in mentions due to lawsuits against their formulas. Then, in Q1 2022, Abbott mentions increased drastically after its formulas were recalled due to possible contamination, taking more than 75% of the mention volume.
Analyzing ESG risks by company
Evaluating the top four brands' ESG risks reveals red flags as early as May 2021, when Abbott was fined for including a banned flavoring in its baby formula (see Figure 5). And most red flags were raised before the national shortage crisis was publicized widely.
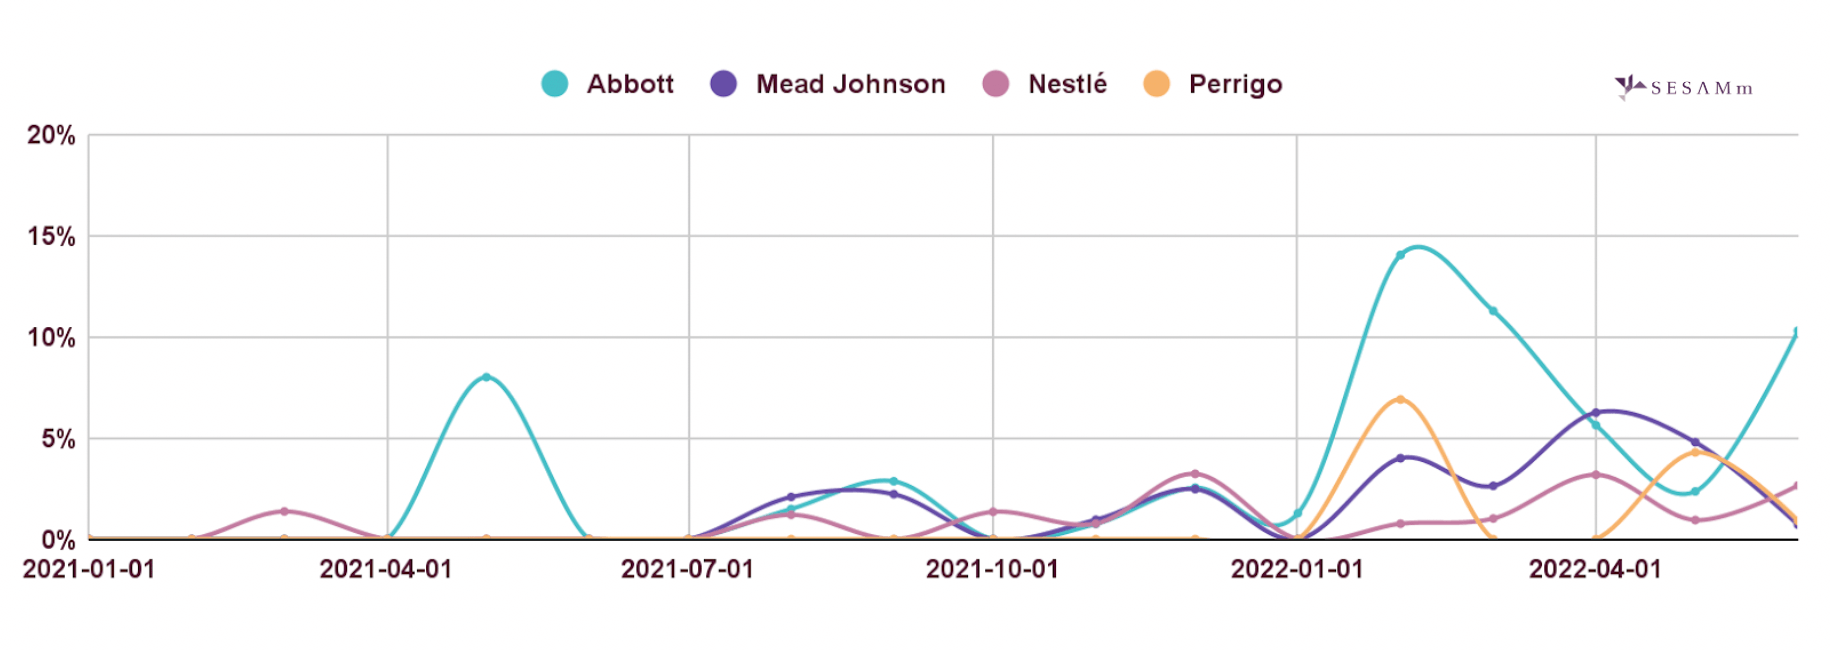
Figure 5: Abbott ESG risk rises above the 5% threshold as early as May 2021.
Besides Abbott, most brands' risks remained low during 2021. However, ESG risks increase during Q1 2022 for all four major formula milk brands. The FDA warned consumers against using specific Abbott formulas during an investigation of infant illnesses possibly caused by Abbott's formulas. Perrigo settles a lawsuit from the State of California over baby formula lead levels. And a panel of federal judges centralizes many baby formula lawsuits into one federal court, including cases against Mead Johnson. Nestlé stays below the 5% threshold throughout, with little to no controversies found.
Three tactics and a summary
The baby formula market in the U.S. has been volatile for many reasons, which we won't get into in this article. However, this volatility could be seen and planned for. In this case, here are some tactics you can take to minimize your investment risks:
- Employ a tool like SESAMm’s TextReveal to evaluate web data for insights into your investments. With premiere NLP technology, you can uncover sentiment and ESG insights about your industry, portfolio companies, or current investments.
- Expand your research term for deeper insights. In this study, the term "formula milk market" had matching absolute and relative volumes. From this view, nothing looks out of place, and there aren't any red flags. However, when we expanded our research with the term "formula milk shortage," we found many controversies before the crisis gained national attention.
- Dig into the controversies' causes. It's not enough to acknowledge a red flag. It would be best if you looked into what the potential reason is. Is the controversy caused by external factors or internal ones? Maybe both? Is the issue a one-time occurrence, or is it a pattern? So it's essential to avoid black-box tools. With solutions such as TextReveal that allow you to see beyond, you can access the underlying articles triggering the red flags.
Stay in touch with SESAMm
Thanks for reading this issue of Alternative Data Trends. Be sure to catch the next issue by subscribing to our blog. And if you'd like a TextReveal demo, send us a message via the form below.

