


Sylvain Forté, CEO and co-founder of SESAMm, presented the following at Finovate 2022. In the presentation, Sylvain explains who SESAMm is, what SESAMm does, including examples, and how it benefits our financial clients.
Below is an approximation of this video’s audio content. Watch the video for a better view of graphs, charts, graphics, images, and quotes to which the presenter might be referring to in context.
Hi, everyone. Thank you very much for the opportunity to be with you today. I’m very glad to introduce you to SESAMm. I’m Sylvain, CEO and co-founder of SESAMm.
We’re an artificial intelligence company specializing in analytics for investment professionals and [corporations]. We basically extract billions of articles and messages from the web and transform them into actionable insights to make better decisions. We’re a team of close to 100 people now, and we generate insights from more than 20 billion articles and messages.
Immediate access to daily insights
Let me jump straight to the demo and give you a practical example of what we do. So imagine you’re, for example, a bank looking to compute environmental, social, and governance risks on your portfolio on your clients or on your suppliers. Right now, you may have access to ratings, which are updated once per quarter or once per year. We can give you access immediately to timely daily data on all of your companies in order for you to better assess risks and raise early warnings.
Wirecard use case
In this specific example (Figure 1), we look at Wirecard, a company that went bankrupt due to a 2 billion fraud scandal in Germany.
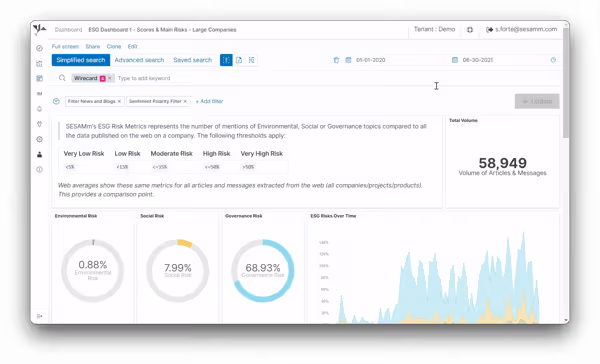
We extracted dozens of thousands of articles and messages on the company, and we can immediately see that there is a huge anomaly in terms of governance risk. The company is basically exposed to fraud accusations, to lawsuits, and the like, things that you don’t really want to see in your clients or your own portfolio.
Furthermore, we can see on this chart that we can get that type of indicator every single day. And we can see that six months prior to the company’s bankruptcy, there were already huge alerts actually here in January 2020, indicating that the company was in a pretty bad situation from the perspective of web content and web data from news to social platforms, blogs, and forums.
We really have the ability to compute live insights for ESG risk, sustainability monitoring, credit, and similar topics. The advantage of the platform is that we can go very deep. You can see here (Figure 2) some of the underlying governance topics associated with Wirecard, such as fraud, embezzlement, and crime—the main accusation—but also things related to anti-competitive practices or corruption.
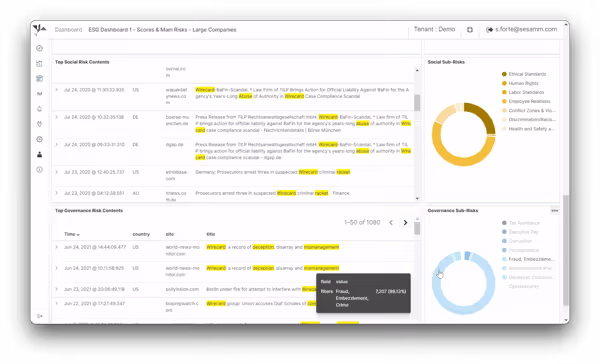
And furthermore, the platform enables full transparency. This is AI at scale, but the underlying content is actually text articles and messages that you can read in order to understand the situation and see why the company is in that risk position. So with our platform, with our text analysis engine (TextReveal®), you can immediately extract content on your portfolio, your clients, your suppliers, and for example, generate ESG insights, competitive insights, sentiment insights, or credit warnings, for example.
Trusted, reliable, and abundant insights
We are today trusted by major financial institutions, such as Nomura [Holdings] or Raiffeisen Bank in the banking sector, for example, or large private equity firms worldwide. The reason why they trust us is that we can provide data more quickly—so waiting one day instead of waiting three months—to get an indicator. In addition to that, we have better coverage. We’re the only company in the world that can provide information on five million different public and private companies, meaning all of your banking clients, for example, are covered. And finally, we have access to a large variety of sources, from social content to news and blogs.
Insights beyond companies
Another example that is very common—sadly right now—is clients asking us to follow the Ukraine Russia War and to understand the current situation, including by getting access to local content in local languages in Ukrainian, in Polish, in Russian, to really understand the news and social media out there.
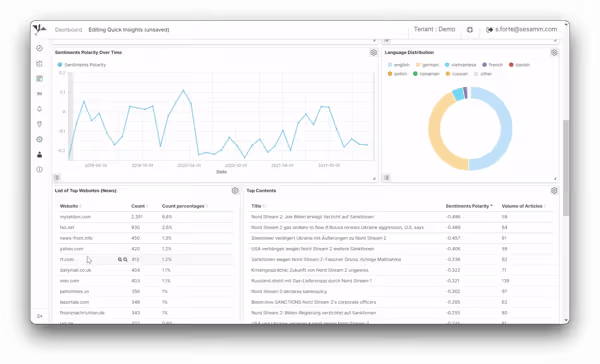
You can see here that beyond companies, we actually track sectors, infrastructure projects, and concepts.
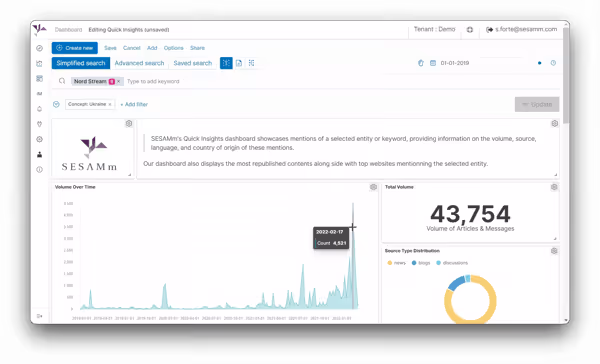
Here (Figure 3), Nord Stream, for example, in the context of Ukraine specifically—so as to understand how these two topics are associated on the web—we can see an explosion in terms of volumes of data over time, the news associating this concept more and more, with more than 40,000 pieces of content. And we can see that sentiment over time, as displayed on this curve (Figure 4), decreases very rapidly, so we see the shock on e-reputation, and we can observe that immediately. And, for example, as a bank or as an asset manager, we can use that to assess the potential risk to clients or portfolio companies.
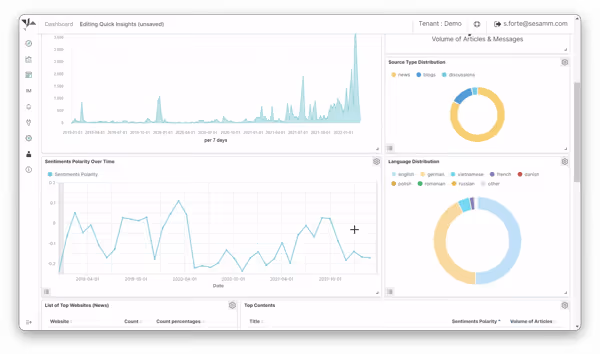
The interesting thing here is that, beyond the graphs and the raw contents, we can look at where the information comes from. Here (Figure 5), you see a lot of information in German, for example, which is not surprising. And you can even follow the Russian propaganda directly from the platform, looking at Russia Today or Sputnik straight from the engine, as these are also sources that we monitor.
And as you can see, these contents are highly customizable and can be used in very specific situations. So this is really a platform as a service (PaaS) that we offer. This is an engine that tracks four million different sources of information, and we can track millions of companies but also even fuzzy concepts, countries, or topics of interest.
Generate analytics from big data with API
One last thought. A lot of our clients integrate with our API; it’s a technical solution. We work a lot with data science teams, data engineering teams, risk teams, quantitative analysts, and heads of innovation. All of these teams are looking to generate analytics from big data and from web content at scale, with solutions that are currently used by dozens of clients worldwide and for which we provide very relevant analytics.
I’ll leave you with three final calls to action.
- The first one is come see us at our booth. We would be very happy to present the solution in a bit more detail.
- The second is, please request a demo. You understand that these indicators can be tailored to your needs in real time. So we’ll be very happy to show you a demo at SESAMm.com.
- And finally, come see us for a free proof-of-concept (POC). We would be very happy to show you how we incorporate these solutions in actual banking tools and in risk management tools.
So the web is now readily available as a system that you can use and that you can rely on in order to generate valuable insights. We’re very happy to provide the solution to the market and to help inform better decisions and to help monitor risks.
Thank you very much.

.avif)


.png)