When Luxury Supply Chains Break Down: What the Loro Piana Case Reveals
July 24, 2025
•
5 mins read
Luxury brand Loro Piana, owned by LVMH, has been placed under a one-year judicial administration by an Italian court after a labor exploitation investigation uncovered serious abuses within its supply chain. According to Reuters, workers at a subcontracted factory were paid as little as €4 per hour and subjected to 90-hour workweeks, often living inside the premises. One worker was reportedly attacked after requesting unpaid wages, requiring 45 days of medical treatment. The case highlights the growing scrutiny of labor conditions in Italy’s fashion manufacturing sector, especially among high-end labels. Loro Piana is now the fifth luxury brand, joining Dior, Armani, Valentino, and Alviero Martini, under court supervision due to supplier-related violations.
A Complicated Web of Subcontracting
What sets this case apart is the complexity of the supply chain. Loro Piana did not contract directly with the workshop where the violations occurred. Instead, it worked through two front companies, both of which lacked actual manufacturing capacity. These intermediaries then subcontracted the work to a network of unregistered or poorly monitored producers. All the firms involved in this chain have been swept up in the investigation.
This multi-tier outsourcing structure made it difficult to detect violations and raises questions about accountability. The Milan court noted that Loro Piana "culpably failed" to supervise its partners, prioritizing cost and output over due diligence.
Why It Matters
Luxury brands trade on trust and exclusivity. Consumers expect not just quality, but integrity, especially regarding sourcing. When serious labor violations are revealed, the reputational risks extend far beyond one product or supplier. They affect brand credibility, investor confidence, and long-term consumer loyalty.
This incident also reinforces a trend: regulators are increasingly willing to intervene when voluntary monitoring fails. Judicial administration isn’t just symbolic; it’s a legally binding oversight mechanism aimed at forcing systemic change.
The Path Forward
For fashion brands, this is a clear signal that supply chain governance must go deeper. That includes mapping indirect suppliers, improving transparency around subcontracting, and enforcing ethical standards at every level. Simply trusting the next link in the chain is no longer enough.
In a sector built on craftsmanship and heritage, safeguarding those values behind the scenes is just as important as what ends up on the runway.
SESAMm’s AI Technology Reveals ESG Insights
Discover unparalleled insights into ESG controversies, risks, and opportunities across industries. Learn more about how SESAMm can help you analyze millions of private and public companies using AI-powered text analysis tools.
In an era of growing regulatory pressure and public scrutiny, staying ahead of ESG-related risks is more important than ever. That’s why we’re introducing UNGC Violation Screening, a powerful new capability that automatically flags ESG controversies potentially breaching the United Nations Global Compact (UNGC) Principles.
Built with compliance and transparency in mind, this feature enables you to:
Stay ahead of reputational and compliance risks
Evaluate global norm breaches with a standardized lens
Focus your attention on the events that matter most
Powered by advanced AI and large language models, SESAMm classifies millions of ESG events in real time, helping you prioritize reputational and compliance risks at scale.
Why UNGC Violation Screening Matters
Whether you're tracking supply chain risks or screening investments for SFDR alignment, SESAMm’s new feature offers a standardized approach to evaluating potential UNGC breaches. It helps you:
Stay compliant: Built to align with the 10 UNGC Principles and SFDR PAI 10, this feature supports streamlined compliance workflows and helps ensure you're meeting disclosure and due diligence obligations.
Surface critical risks fast: Quickly detect ESG controversies tied to UNGC violations, without relying solely on manual review.
Violator: Clear and explicit breaches of the UNGC Principles, backed by evidence such as official sanctions, public admissions, or substantial regulatory fines.
Watchlist: Potential serious violations where evidence is partial or inconclusive. These events suggest possible misconduct but fall short of confirming a clear breach.
Low Risk: Events that raise concerns but lack evidence of a UNGC violation. While no breach is confirmed, these cases still merit monitoring.
Each classification includes a justification, offering full transparency into the rationale behind the label. For example:
"Shein’s acknowledgment of child labor practices within its supply chain raises serious concerns regarding human rights violations and labor standards. The company’s prior actions [...] indicate a high-risk breach of multiple UNGC principles.”
A Closer Look: Rio Tinto
Consider the case of Rio Tinto, which agreed to pay a $15 million fine following foreign bribery charges. The company was accused of making improper payments to a consultant linked to a former Guinean official to secure mining rights in Guinea. Since then, Rio Tinto has cooperated with the investigation, improved its internal controls, and terminated employees involved in the misconduct, while maintaining its commitment to ethical business practices.
While serious, SESAMm’s UNGC Violation Screening labeled this incident not as a full violation, but rather Watchlist level. Why? Because investigators acknowledged that the company:
Cooperated with authorities
Was unaware of the employee’s misconduct
Took disciplinary action and corrective steps
This demonstrates the power of SESAMm’s nuanced approach: balancing evidence and context to provide actionable, explainable insights.
UNGC Screening: Designed for Today’s Compliance Landscape
As expectations rise, investors, sustainability teams, and risk managers need tools that go beyond checkbox compliance. SESAMm’s UNGC Violation Screening delivers speed, clarity, and global coverage, helping you meet your due diligence goals and protect against reputational fallout.
Ready to integrate UNGC breach detection into your workflow? Contact us to learn more or request a demo.
SESAMm’s AI Technology Reveals ESG Insights
Discover unparalleled insights into ESG controversies, risks, and opportunities across industries. Learn more about how SESAMm can help you analyze millions of private and public companies using AI-powered text analysis tools.
The landscape of the finance sector is evolving rapidly. A few weeks ago, SESAMm announced a new addition to its technologies, Generative AI. This tool is key to enhancing decision-making, streamlining operations, and staying ahead in the industry.
During our recent webinar, CEO Sylvain Forté sheds light on SESAMm’s integration of Generative AI for private equity and asset managers. If you missed the session or need a refresher on the key takeaways, watch the replay here:
For in-depth insights into the future of finance powered by Generative AI, check out our Generative AI series.
TextReveal's web data analysis of over five million public and private companies is essential for keeping tabs on ESG investment risks. To learn more about how you can analyze web data or request a demo, contact one of our representatives.
The European Union stands at the forefront of global efforts to promote environmental, social, and governance (ESG) accountability. As the world becomes increasingly ESG-aware, the EU has developed a comprehensive regulatory framework designed to ensure transparency and accountability across all sectors.
These regulations represent the EU's commitment to sustainable development and responsible business practices. However, the regulatory landscape is evolving, with the February 2025 EU Omnibus Proposal introducing potential modifications aimed at reducing the regulatory burden on businesses. However, these proposals come at the risk of substantially undercutting the impact of the regulations.
This article recaps the current ESG regulatory framework in the EU, explores the changes proposed by the Omnibus, analyzes the potential impacts of these modifications, and discusses how financial institutions can navigate this evolving landscape while maintaining compliance.
The ESG Regulatory Landscape in the EU
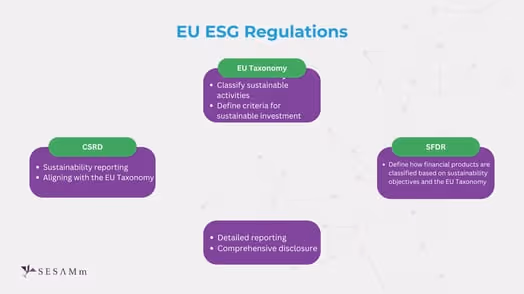
The EU is advancing sustainability through a framework of regulations that enhance corporate accountability and reporting on ESG impacts. These measures aim to promote genuine sustainable practices and address international trade and emissions challenges. Though comprehensive, these regulations are also, at times, confusing in the way they overlap and impact each other. To get started, let’s examine the EU Taxonomy, SFDR, and CSRD—a triad of interconnected regulations designed to streamline and strengthen sustainable investing practices.
EU Taxonomy
The EU Taxonomy provides a classification system for environmentally sustainable economic activities, offering clear criteria to determine whether an economic activity can be considered "green."
Key Aspects of the EU Taxonomy
Defines criteria for environmentally sustainable economic activities
Requires companies subject to CSRD to report on Taxonomy alignment
The Taxonomy helps channel investment toward genuinely sustainable projects and businesses by creating a common language for sustainable activities.
Status
The EU Taxonomy has been operational since January 2022 with phased implementation. As of March 2025, companies subject to CSRD must disclose their taxonomy alignment percentages.
Sustainable Finance Disclosure Regulation (SFDR)
The SFDR focuses specifically on the financial sector, requiring financial market participants to disclose how they integrate ESG risks into their investment decisions and the sustainability impact of their financial products.
Key Aspects of SFDR
Requires disclosure of ESG risks in investment processes
Classifies financial products based on their sustainability characteristics
Aligns with EU Taxonomy criteria for sustainable investments
Aims to prevent greenwashing in financial products
The SFDR plays a crucial role in bringing transparency to the rapidly growing sustainable investment market.
Status
Fully implemented since March 2021, with enhanced Level 2 requirements since January 2023. All EU financial market participants must classify products under Articles 6, 8, or 9. Current market data shows that 28% of EU funds are compliant with Article 8 and 5% with Article 9, with a significant trend of reclassification from Article 9 to 8 due to stricter interpretations.
The CSRD stands as a cornerstone of the EU's ESG regulatory framework, requiring companies to report comprehensively on their environmental, social, and governance impacts. This directive mandates alignment with the EU Taxonomy, ensuring standardized reporting of sustainability metrics.
Key Aspects of CSRD
Requires detailed reporting on ESG impacts
Aligns with EU Taxonomy criteria for sustainability
Currently applies to companies with 250+ employees
Enhances corporate transparency on sustainability issues
The CSRD represents a significant step forward in standardizing sustainability reporting across the EU, providing investors, consumers, and regulators with comparable information on corporate sustainability performance.
Status
The CSRD, adopted in November 2022, replaces the Non-Financial Reporting Directive (NFRD). The transition to CSRD reporting was originally slated to begin in 2025 and would expand the number of companies subject to reporting requirements to 49,000 (vs 11,700 under NFRD). However, as we’ll see later, the Omnibus may push back the timing of CSRD.
Outside of the EU Taxonomy, SFDR, and CSRD, the Omnibus Proposal highlights two other key ESG regulations: CSDDD and CBAM. These regulations relate to corporate accountability for supply chains and to limiting carbon leakage.
Corporate Sustainability Due Diligence Directive (CSDDD)
The CSDDD focuses on corporate accountability throughout global supply chains, requiring companies to identify, prevent, and mitigate human rights and environmental risks associated with their operations.
Key Aspects of CSDDD
Requires companies to identify and mitigate human rights and environmental risks
Applies to full supply chains, ensuring comprehensive oversight
Applies to EU companies with 1,000+ employees and €450 million+ global turnover and non-EU companies with over €450 million EU turnover
Mandates regular monitoring and reporting on due diligence efforts
Strengthens corporate accountability for sustainability across operations
This directive acknowledges that a company's sustainability impact extends beyond its direct operations, encompassing its entire value chain.
Status
CSDDD was adopted in April 2024. Its phased implementation is slated to start in June 2026 and be completed by June 2028. The timing and scope of CSDDD is subject to change following the Omnibus Proposal.
Carbon Border Adjustment Mechanism (CBAM)
The CBAM is an innovative approach to preventing carbon leakage. It levies a carbon tax on imports to ensure that the EU's ambitious climate policies do not simply shift carbon-intensive production outside its borders.
Key Aspects of CBAM
Imposes a carbon tax on imported goods
Requires importers to report emissions data
Ensures payment for embedded carbon costs in imported products
Aims to prevent carbon leakage to regions with weaker climate policies
This mechanism aims to create a level playing field for EU producers subject to carbon pricing while encouraging global partners to implement similar carbon pricing mechanisms.
Status
The transitional phase for CBAM began in October 2023, with full implementation scheduled for January 2026. It currently covers cement, iron and steel, aluminum, fertilizers, electricity, and hydrogen. The certificate requirements will phase in gradually from 30% in 2026 to 100% by 2034. It’s expected to apply to 1.8 million EU importers and generate €5-14 billion in annual revenue when fully implemented.
The February 2025 EU Omnibus Proposal
Purpose and Goals
The EU Omnibus Proposal represents a significant recalibration of the EU's regulatory approach, seeking to balance sustainability ambitions with business competitiveness concerns.
The primary objectives of the Omnibus focus on alleviating regulatory burdens faced by businesses, simplifying compliance requirements, and streamlining reporting obligations. These efforts aim to enhance business competitiveness while addressing regulatory complexity concerns. By minimizing these challenges, the goal is to create a more favorable environment for businesses to thrive. However, this push for simplification could come at the expense of transparency and accountability, especially in sectors where regulation plays a protective role.
Impact Analysis: How the Omnibus Changes ESG Compliance
Below, we’ll take a closer look at each regulation and the changes proposed by the Omnibus Proposal.
EU Taxonomy Modifications and Implications
The Omnibus Proposal suggests a Level 2 modification to the application of the EU Taxonomy, reducing the number of companies required to report taxonomy alignment.
Key Changes:
Taxonomy alignment reporting is limited to companies subject to CSDDD
Voluntary reporting option for companies not required to comply
Possible Implications:
Reduced availability of standardized sustainability data
Increased difficulty in verifying "green" business claims
Higher risk of greenwashing in financial markets
Less reliable information for sustainable investors
These modifications would potentially undermine the Taxonomy's role in creating a common language for sustainable activities.
CSRD Modifications and Implications
The Omnibus Proposal significantly narrows the scope of the CSRD, reducing the number of companies required to report on ESG impacts.
Key Changes:
Threshold increase from 250+ to 1,000+ employees
Optional reporting for SMEs
A two-year delay in reporting obligations for some companies
Possible Implications:
80% reduction in companies required to report
Decreased transparency in corporate sustainability performance
Fewer sustainability data available to investors and regulators
Potential challenges in tracking sustainability progress
These modifications would substantially reduce the regulatory burden on smaller companies but raise concerns about the availability of comprehensive sustainability data.
CSDDD Modifications and Implications
The Omnibus includes significant modifications to CSDDD, with a narrowed scope and reduced monitoring requirements.
Key Changes:
Due diligence is limited to direct suppliers with over 500 employees, not full supply chains
Monitoring frequency reduced from annual to every 5 years
Delayed enforcement for one year for the first batch (Companies with 1.5 billion in turnover and 5000 employees)
Possible Implications:
Weakened corporate accountability for supply chain sustainability
Increased risk of undetected human rights and environmental violations
Reduced monitoring of global supply chain impacts
Extended timeline before full implementation
These changes would significantly reduce companies' compliance burdens but come at the risk of removing the essence of the directive, which is eliminating child labor, forced labor, etc.
SFDR Modifications and Implications
While not directly modified, changes to other regulations, particularly the EU Taxonomy, indirectly affect the SFDR.
Indirect Impacts:
Reduced availability of reliable ESG data
Challenges in differentiating truly sustainable investments
Potential increase in greenwashing risk
These indirect effects could undermine the SFDR's effectiveness in bringing transparency to sustainable investment products.
CBAM Modifications and Implications
The Omnibus Proposal simplifies CBAM compliance, particularly for smaller importers.
Key Changes:
Small importers (under 50 metric tons/year) are exempted
Reduced reporting burden for over 182,000 businesses
Possible Implications:
Simplified compliance for small businesses
Potential loophole risk if companies split shipments to stay under the threshold
Maintained coverage of 99% of emissions despite exemptions
These modifications would maintain the CBAM's effectiveness while reducing the administrative burden on smaller importers.
The Debate: Perspectives on the Omnibus Proposal
Arguments in Favor
Proponents of the Omnibus Proposal emphasize its benefits for business competitiveness and regulatory efficiency. They highlight the reduced administrative burden, especially for small and medium-sized enterprises (SMEs), which often struggle with complex regulations. Additionally, the changes aim to simplify compliance requirements, making it easier for businesses to adhere to regulations. By aligning with global standards, the proposal helps maintain the EU's economic competitiveness while promoting a more efficient allocation of resources across industries. Together, these factors create a more streamlined and supportive environment for businesses to thrive.
As BusinessEurope Director General Markus J. Beyrer stated: "Doing better with fewer and clearer norms is what European companies of all sizes are asking for. By reducing unnecessary reporting and regulatory burdens, the first Omnibus will allow companies to contribute more effectively to the EU's sustainability objectives while also preserving the EU economy's competitiveness."
European Commission President Ursula von der Leyen also expressed support for the proposal, stating: "EU companies will benefit from streamlined rules. This will make life easier for our businesses while ensuring we stay firmly on course toward our decarbonization goals."
Criticisms and Concerns
Critics raise significant concerns about the potential undermining of the EU's sustainability ambitions. They argue that the Omnibus Proposal may lead to unintended consequences, including reduced transparency in corporate sustainability performance, weakened supply chain accountability, and regulatory uncertainty during transition periods. Additionally, it could undermine sustainability objectives and increase the risk of greenwashing. As Mariana Ferreira from WWF European Policy Office commented:
"The Commission's sudden urge to destroy laws that are crucial for the achievement of the EU Green Deal is a perilous approach that is forcing Europe into a time of regulatory uncertainty. Under the guise of 'simplification,' the Commission put forward a proposal that will hinder economic and business success."
"The Omnibus proposal erodes EU's corporate accountability commitments and slashes human rights and environmental protections."
While the European Parliament debates the Omnibus Proposal, the fact remains that even if the regulations are delayed or loosened, the need for risk management remains unchanged. Investors require transparency, and companies must manage supplier risk effectively.
Navigating ESG Risks with SESAMm
SESAMm’s cutting-edge AI solutions empower investors, financial institutions, and corporations to navigate the complexities of ESG compliance with confidence. Leveraging an industry-leading data lake and state-of-the-art AI, SESAMm uncovers hidden risks in supply chains and target companies, providing real-time insights that drive proactive decision-making. By transforming regulatory challenges into opportunities for responsible and sustainable growth, SESAMm helps businesses stay ahead of evolving ESG requirements while mitigating risk and enhancing transparency.
SESAMm’s AI Technology Reveals ESG Insights
Discover unparalleled insights into ESG controversies, risks, and opportunities across industries. Learn more about how SESAMm can help you analyze millions of private and public companies using AI-powered text analysis tools.
Stay ahead with the latest in ESG and AI intelligence
Join our mailing list to receive new reports, event invites, and updates from SESAMm directly to your inbox.

-converted-from-svg.avif)


%20(1).avif)


.png)