Hydropower tops ESG controversy volume across 250,000+ projects, outranking coal. Why the greenest label in energy hides the heaviest social risk.
An analysis of over 250,000 infrastructure projects reveals that the sector most often filed under "clean energy" carries the heaviest environmental and social controversy footprint of any asset type assessed.
In the taxonomy of energy infrastructure, hydropower occupies a comfortable position. It is renewable, dispatchable, and long-lived, and it enters transition frameworks, green bond eligibility criteria, and net-zero roadmaps with minimal friction. Where coal is a legacy liability to be managed down and nuclear invites a specialized debate, hydropower is largely treated as settled. What these projects have actually done does not support that treatment.
Belo Monte, an 11,233 MW complex on the Xingu River in Pará, Brazil, is the sharpest test of the point, because it was built to answer this exact objection. Approved after decades of opposition to a far larger design, it was engineered as a run-of-river plant to minimize flooding, and its reservoirs cover 478 km², of which 274 km² was already river channel at high water, a 61% reduction compared with the 1980s proposal, according to the operator's own regulatory filing. The mitigation was designed from the start, and everything that follows happened regardless.
Biodiversity: the cost of a physical footprint
Environmental controversy across infrastructure concentrates on industrial accidents, water pollution, and biodiversity, and hydropower leads the third, outright, because dams require the permanent conversion of river systems and the land around them. Mexico's Federal Electricity Commission won environmental approval in September 2014 for the Las Cruces dam on the San Pedro Mezquital, upstream of Marismas Nacionales, a Ramsar-protected wetland, even though the project's own impact statement conceded that the damage to Indigenous ceremonial sites could not be mitigated. Along the Mekong River, river health and fish populations fell as dam construction spread through the basin. In Brazil, the Doce River carried a mass release of toxic material after an upstream failure. Elsewhere, the record includes violations of the Endangered Species Act and documented disruption to rainfall patterns.
At Belo Monte, the consequences have been measured rather than projected. The plant diverts water into a canal that bypasses a 130-kilometer stretch of the Xingu known as the Volta Grande, which has received less than 30% of its natural annual discharge since 2019, and some 86% of the stretch's seasonally flooded vegetation, 30,748 of 35,600 hectares, can no longer be inundated at all. The gap lies in the regulator's own file: IBAMA's technical staff called for 10,900 cubic meters per second in February, the historic peak month, compared with the 1,600 that the operating regime actually releases. Seven years of underwater video survey data published in Scientific Reports recorded total fish species richness falling from 62 to a post-operation average of 51, with the steepest losses near the dam and in the rocky rapids, which hold roughly 2.6 times as many species as sandy reaches. The zebra pleco, whose entire known range lies inside the dewatered stretch, now sits on Brazil's national list of threatened species as critically endangered.
None of this is an accident or a failure of operation. It is a structural consequence of the asset. A well-run dam still floods a valley, and a dam engineered specifically not to flood one still dewater the river below it.
When engineering fails: hydropower's physical risk profile
Coal mining leads infrastructure on industrial accidents, where the record is dominated by human tragedy and safety negligence: explosions, collapses, fires, and repeated, incremental failures. Hydropower ranks second, but its accidents take a different form, because in this sector, industrial failure means catastrophic engineering failure at scale. The record includes pipe ruptures causing severe land erosion, oil leaks, and dam collapses that killed and displaced people across whole regions, while PG&E's settlement over damages to the Middle Fork American River Hydroelectric Project and the litigation still running in Brazil after dam collapses give a sense of the exposure a single event can generate. For anyone underwriting these assets, the distinction is financial as much as physical: a coal mine's safety record is a rising cost curve, while a dam's structural integrity is a low-probability, near-unbounded loss.
At Belo Monte, that exposure has so far been financial. The project was budgeted at R$28.9 billion when Brazil's development bank approved a then-record R$22.5 billion loan in November 2012, and by late 2017, actual investment had reached R$38.6 billion, roughly 34% over. The operator owed R$28.3 billion to lenders and debenture holders at the end of 2024. Aliança Norte Energia Participações, the Vale and Cemig vehicle holding a stake in the project, discloses a possible loss of R$3.05 billion from a single construction-delay claim and describes the operator's liquidity as its principal point of attention and a source of investor alert. Neoenergia wrote off its own 10% holding by R$482 million in the fourth quarter of 2021.
The physical risk has been closer than the absence of a collapse suggests. In October 2019, the operator wrote to the national water regulator declaring an emergency, because reservoir levels had fallen far enough to expose an unprotected section of the Pimental dam's earthfill base to wind-driven wave erosion and, in the company's own words, structural damage. It cut outflow below the level agreed with the environmental regulator to protect the structure, and the letter surfaced only through investigative reporting.
Beyond the environment: displacement, water, and chronic corruption
Right to property
Hydropower ranks first among infrastructure sectors for property disputes, a direct function of the footprint a dam and reservoir require. The record shows land seizures, forced displacement, compensation that arrives short or not at all, communities never consulted before ground was broken, and blasting that cracked the foundations of nearby homes. Those affected are frequently the least equipped to hold an operator to account.
Fifteen years after Belo Monte broke ground there is still no audited count of who lost their homes. Estimates run from 20,000 to 40,000 depending on the definition used, against the operator's account of rehousing some 6,000 urban families. Landowners say expropriations are priced at unadjusted 2013 values while the project's own construction boom inflated the market, and as of 2025 none of the land required for the riverine resettlement program had been bought. A petition filed with the Inter-American Commission in 2011 still has no ruling.
Community health and safety
Hydropower sits alongside coal and nuclear as a leading source of community health disputes, but it arrives by a different route. Coal delivers PM2.5, nuclear delivers radioactive anxiety, and hydropower delivers water mismanagement: overconsumption that strips farmers of a livelihood, contaminated water reaching local crops. The grievance is agricultural rather than industrial, which widens the affected population considerably.
On the Volta Grande, catch per fisher fell from 11.1 kilograms a day between 2001 and 2008 to 4.53 kilograms between 2020 and 2023. A randomized household survey found 38.5% of residents in Belo Monte's resettlement neighborhoods living with moderate or severe food insecurity, against 28.3% across the surrounding city. In June 2026, federal prosecutors sought as interim relief for 635 families along the reduced-flow stretch the emergency delivery of three and a half to five liters of drinking water per person per day.
Corruption and bribery
Corruption and bribery accounts for close to 30% of governance controversy across infrastructure. What separates hydropower is the pattern. In airports, nuclear, and coal, corruption surfaces as discrete scandals: a probe opens, executives are charged, attention fades. In hydropower it keeps returning, tied repeatedly to falsified records and payments to local officials to secure land and water rights. Isolated scandals point to isolated actors. A pattern that recurs points to how these projects get permitted.
Brazilian prosecutors alleged that Belo Monte's construction contracts carried bribes worth 1% of their value, and three contractors admitted cartel conduct and kickbacks under leniency agreements that carried immunity. Everything after that was procedural closure rather than a finding of liability: the principal defendants were acquitted and the acquittal upheld on appeal in 2024, the competition authority archived its bid-rigging case in 2025, and no individual has been convicted in connection with the project. An investor screening for enforcement outcomes would have found a closed file. The costs landed elsewhere, in permitting delay, financing conditions, and a minority stake that has been for sale since 2022 without a buyer.
Hydropower's risk concentration: what this means
Hydropower's classification as clean energy is accurate on the metric it was designed to measure, because generation is low-carbon. But carbon intensity is one dimension of sustainability, and it is not the dimension that produces operational friction, legal exposure, or the loss of a social license.
What drew sustained opposition to these projects was water rights, displaced communities, cracked foundations, converted wetlands, and permits secured through local payments. None of it appears in a carbon accounting framework.
For investors, insurers, and lenders seeking transition-aligned infrastructure exposure, that is a material blind spot: an asset class that screens well on the primary criterion while carrying the heaviest social burden in the dataset, and carrying it on behalf of people who have no employment relationship with it. Belo Monte was engineered to avoid precisely that outcome and produced it regardless, which suggests the exposure is not a function of how a dam is built but of what a dam is.
The label is not wrong. It is simply measuring something other than risk.
Housing and construction fees have skyrocketed over the past few years. This increase goes back to multiple factors: economic unrest, raw materials disruption, and labor shortage, to name a few. What does web data have to say about all this?
In this week’s “Alternative Data Trends” issue, we’ll talk about commercial real estate, unveiling the industry’s ESG and SDG conformity and the effects of COVID-19 on the supply chain and labor.
Commercial real estate volume of mentions
While analyzing web data dealing with commercial real estate, we detected an evident increase in the industry’s volume of mentions. This trend spiked in April 2020 and was initially hindered by the COVID pandemic, which resulted in a drop in sentiment polarity. Still, it witnessed a rapid recovery leveraging digitalization and e-solutions (Figure 1).
Figure 1: Commercial real estate market mentions Feb 2015 to Mar 2022.
Case study: Unibail-Rodmaco-Westfield
To further understand the commercial real estate industry, we studied Unibail-Rodamco-Westfield and its competitors. Unibail-Rodmaco, a French commercial real estate company, acquired Westfield, a U.S. company, in December 2017. This acquisition accentuated its market share and grew its web voice share compared to its competitors (Figure 2).
Figure 2: Unibail volume of mentions compared to the market.
The chart in Figure 3 shows that the company’s volume of mentions has been increasing ever since the acquisition occurred. However, a negative sentiment polarity has been steadily increasing due to social ESG risks related to collective health crises during COVID and security-disrupting threats. In addition, the company faced difficulties collecting rent from retailers leading to lawsuits.
The arrows in this chart indicate Unibail ESG risks in time. The first arrow points to the social risks generated by security threats, in 2016, and the second arrow points to the issue of unpaid rent and lawsuits filed regarding the matter, in 2020.
Figure 3: Unibail ESG risks.
According to web data, Unibail has the second highest volume of sustainability mentions among analyzed groups. The company was notably related to sustainable development goals number 8* and number 12**. This volume is manifested in their initiatives to help unemployed people and maintain sustainable ethics and practices when launching their malls and shopping centers (Figure 4).
* Social development goal for decent work and economic growth.
** Social development goal for responsible consumption and production.
Figure 4: Unibail SDG volume of mentions compared to the market.
The impact of COVID on the emerging commercial real estate market
As previously mentioned, COVID had several effects on the industry, both negative and positive. Furthermore, it reshaped the market and its work policies. Some companies, as well, chose to switch to remote work and digitalization. In Figure 5, we can see that sentiment related to remote work policies has steadily improved since the pandemic started. However, in the last few months, we’ve seen a sharp decline, potentially signaling a negative reaction to some companies requiring employees back to their offices.
Figure 5: Remote work policies’ volume of mentions.
In addition, the pandemic has resulted in labor shortage and supply chain disruption, eventually leading to tremendous inflationary pressure. Raw materials prices, including oil, gas, iron, and wood, have witnessed a drastic increase and a disequilibrium between the volume of demand and the quantity available (Figure 6).
Figure 6: Labor shortage and supply chain disruption Feb 2015 - Dec 2021.
Data source
To produce this analysis, we combined natural language processing with billions of textual web data related to the real estate market, commercial real estate in particular. Using NLP-powered models gives us an edge as we can extract ESG, SDG, and financial insights that aren’t necessarily obvious or easy to detect. These insights help investors make better investment decisions.
SESAMm leverages artificial intelligence and machine learning to help you decipher and understand timely sentiments, trends, and ESG metrics on a wide range of public and private companies.
Stay in touch with SESAMm
Thanks for reading this issue of Alternative Data Trends. Be sure to catch the next issue by subscribing to our blog. And if you'd like a TextReveal® demo, send us a message via the form.
In this issue of the "what investors ought to know about…" series, we'll cover natural language processing (NLP), a tool that draws from the computer science and computational linguistics disciplines. In the last topic, we discussed knowledge graphs as the core of text analysis. And if knowledge graphs are the core of the data’s context, NLP is the transition to understanding the data.
What is natural language processing?
Natural language processing is an artificial intelligence (AI) technology that automates the data analysis of mined textual, unstructured data to include natural language understanding and natural language generation to simulate a human's ability to create language. It combines computational linguistics with machine learning and deep learning models, performing a special linguistic analysis by algorithms so a machine can "read" text.
Where is natural language processing used?
Today, various industries use NLP, from email filters to virtual assistants and search engines to chatbots. Here's a list of common ways natural language processing is used:
Chatbots: Chatbots are computer programs that use NLP. They simulate human conversation by identifying a sentence's intent, determining suitable topics, keywords, and emotions, and calculating the best response based on the data's interpretation.
Email filters: Email filters apply machine learning using many data samples to sort emails into the right inbox.
Machine translation: Translation software like Google Translate or Microsoft Translator use NLP to translate text from one language to another, such as English to French.
Natural language generation (NLG): NLG, a subfield of NLP, builds applications or computer systems that can automatically produce natural language texts of various types by using a semantic representation as input. Applications of NLG include question answering and text summarization.
Predicting and autocorrecting text: Predictive text and autocorrect use NLP to recognize and recall commonly used words and names to make text suggestions and correct common errors.
Search engines: Search engines like Google search use NLP machine learning to interpret a searcher's intent and provide relevant results. It can even suggest subjects and topics related to the query the searcher might be interested in.
Virtual and voice assistants: Virtual assistants like Apple's Siri or Amazon's Alexa use NLP technology to understand and respond to voice requests. Speech-to-text can dictate messages and notes, and speech recognition can control everything from smartphone apps and smart speakers to thermostats and home security systems.
Web sentiment analysis: Sentiment analysis automates classifying opinions in a text as positive, negative, or neutral. It's a method companies like SESAMm use to monitor sentiments like a brand's sentiment on the web and social media.
Why natural language processing is important to uncover financial-related alternative data
NLP is important because it helps resolve human language ambiguity in big datasets (big data). Languages are complex, diverse, and expressed in unlimited ways, from speaking hundreds of languages and dialects to having a unique set of grammar and syntax rules, slang, and terms for each. In text form, these variables are unstructured text. But with NLP, we can transform unstructured data into structured data and make sense of it.
Because of NLP's power, investors can research and analyze unstructured data from the web to gain insights into financial and ESG data. You can use this wealth of information to focus on systematic data processing, risk management, and alpha discovery through contexts, such as:
Major global indices sentiment
Euronext exchange sentiment
Private company sentiment
ESG risks for public and private companies worldwide
A quick overview of how natural language processing works at SESAMm
At SESAMm, we use named entity recognition (NER), which extracts the names of people, places, and other entities from text, and then named entity disambiguation (NED) to identify named entities based on their context and usage. For example, text referencing "Elon" could refer indirectly to Tesla through its CEO or a university in North Carolina. NED considers the context when classifying entities for an accurate match. Compared to simple pattern matching, which limits the number of possible matches, requires frequent manual adjustments, and can't distinguish homophones, NED is superior.
Process representation for NER and NED.
When identifying entities and creating actionable insights, SESAMm uses three other NLP tools: lemmatization and stemming, embeddings, and similarity. The lemmatization process normalizes a word into its base form (morphology) to help identify and aggregate entities. Embedding assigns the entity a numerical value to help analyze how words change meaning depending on context and understand the subtle differences between words that refer to the same concept—similarity measures whether two words, sentences, or objects are close to one another in meaning.
Representation of nodes in a knowledge graph.
Of course, NLP couldn't function without the core of the text analytics process: knowledge graphs. A knowledge graph is a digital representation of a network of real-world entities, the foundation of a search engine or question-answering service. This structured data model puts the schema in context through semantic metadata and linking, providing a framework for analytics, data integration, sharing, and unification. In other words, it's like a map and legend, with the legend labeling the concepts, entities, and events and the map connecting and identifying their relationships. These details are stored in a graph database and visualized as a graph representation, hence the term knowledge graph.
SESAMm's natural language processing platform for investment research and analysis
SESAMm is the leading provider of natural language processing and machine learning solutions and analytics for investment firms and corporations.
May 2, 2022. The S&P 500 ousts Tesla, Inc. from the S&P 500 ESG Index. Tesla is widely recognized as the firm that ushered electric vehicle making into the mainstream. So the index’s move seems unreasonable or possibly made in error to many, raising some interesting questions:
How does an environmentally-friendly corporation like Tesla get dropped from an ESG index?
Why does a potentially non-environment-friendly company like Exxon make the ESG index and remain on it?
What do these moves mean about the integrity and validity of ESG scores and ratings?
Global industry group peers pushed Tesla’s S&P DJI ESG Score further down the ranks in the GICS industry group: Automobiles & Components.
A decline in criteria level scores related to Tesla’s low carbon strategy and codes of business conduct contributed to its 2021 S&P DJI ESG Score.
A media and stakeholder analysis identified "two separate events centered around claims of racial discrimination and poor working conditions at Tesla’s Fremont factory."
The analysis also highlights "the handling of the NHTSA investigation after multiple deaths and injuries were linked to its autopilot vehicles, affecting the company’s S&P DJI ESG Score at the criteria level, and its overall score."
Companies, including Tesla, left out of the S&P 500 ESG Index post-rebalance. Image courtesy of Indexology Blog.
The S&P blog post summarizes their case about dropping Tesla, "While Tesla may be playing its part in taking fuel-powered cars off the road, it has fallen behind its peers when examined through a wider ESG lens." And in this statement lies the crux of why the index dropped Tesla and why others are still on.
Analyzing Tesla’s web data
SESAMm’s TextReveal® insights suggest that the S&P 500’s decision to remove Tesla could be justified based on increasing controversy levels concerning discrimination, ethical standards, and work health and safety. By analyzing text related to ESG topics across the web, we picked up trends for the following subtopics:
climate_change_atmospheric_pollution
ethical_standards
discrimination_racism_sexism
labor_standards
health_and_safety_at_work
general_environmental_impact
Tesla’s ESG scores (six subtopics)
Figure 1: Tesla ESG scores for volumes and sentiments (1-year moving average), all source types.
Regarding the volume features (Figure 1), we observed a significant increase in the scores related to ethical standards, discrimination, and atmospheric pollution for Tesla before the controversy. The conclusions are mostly the same for ESG sentiment (negative) scores. An interesting note is that the negative score of health and safety at work slightly increased in the months before the removal of Tesla from the index.
Figure 2: Tesla ESG scores for volumes and sentiments (1-year moving average), all source types, select subtopics.
Comparing Tesla’s sentiment with other S&P 500 ESG Index companies
To see how Tesla’s ESG sentiment scores compared with other companies, we must rescale them with respect to a large universe of companies. This process means that for a given company, we use percentiles of the distribution of each subtopic’s ESG score to do a rescaling to the S&P 500 ESG constituents list after the 2022 rebalancing. Rescaling allows us to compare the companies with each other because the rescaled score indicates how bad the company is compared to the others, according to a specific ESG subtopic.
The following graphs show different sets of subtopics, plotting the mean of the respective rescaled scores if several topics are considered. Here are the companies considered.
Companies removed from the index:
Tesla
Delta Air Lines
Chevron Corporation
Companies that joined the index after the 2022 rebalancing:
American International Group
Expedia Group
Companies still part of the index:
Exxon Mobil
Apple
Amazon
Tesla, Delta, Chevron, AIG, and Expedia compared
Figure 3: Six-subtopic rescaled scores for Tesla, Delta, Chevron, AIG, and Expedia.
Apple, Amazon, and Exxon compared
Figure 4: Six-subtopic rescaled scores for Apple, Amazon, and Exxon.
The S&P 500’s choice is reasonable
Our analysis shows that the S&P 500’s decision to oust Tesla from the ESG index is reasonable. We found significant subtopic volumes and negative sentiment that support the S&P 500’s claims of racial discrimination, poor working conditions, and other controversies.
Thanks for reading this quick analysis. For a more detailed report, including Chevron’s and Delta’s ESG scores, reach out to a representative today.
SESAMm’s ready-to-use alternative data
Leverage our alternative data streams to incorporate systematic insights into your alpha signals or risk monitoring your entire portfolio. From tracking global sentiment to analyzing retail communities like WallStreetBets and integrating ESG alternative data into your systems, our solutions will make generating value from web insights easy.
Imagine finding out you've run out of milk immediately after pouring a bowl of cereal. Or maybe realizing you don't have eggs while in the middle of baking a cake. We've all been there, and it's frustrating, to say the least. And this scene has been playing around the globe over the last couple of years for many foods and products. One day it's microchip shortages, and the next, it's baby formula.
Unfortunate as it is, it's one thing for consumers to cope with an empty car lot because of chip shortages. It's another to cope with a hungry infant because store shelves that once contained baby formula are now bare. For those parents and caretakers, their emotions are beyond feeling frustrated. They feel anger and panic, the sort of emotions that they share with their friends and colleagues on social media and forums. The kind of expression that can change the public's sentiment about a company, which in turn can move markets.
This Alternative Data Trends post will examine web data concerning the baby formula shortage. We'll analyze articles, social media, and forum conversations culminating in the U.S. crisis as the news reaches national exposure. We'll also highlight red flags investors could've seen had they monitored the situation with an AI-powered text analysis tool like SESAMm's TextReveal®.
Early warnings: When baby formula supplies began to run dry vs. when it became a national crisis
If we compare absolute and relative volumes—relative being mentions about the topic compared to our entire data lake—the term "formula milk market" yields parallel results. Mentions spike in May when the crisis reaches national coverage (see Figure 1).
Figure 1: Absolute and relative mention volumes for “formula milk market” match.
However, comparing absolute and relative volumes for the term "formula milk shortage," we find red flags as early as January 2022, four months before the crisis receives national attention (see Figure 2). Relative mentions spike on three occasions before absolute volumes register any significant noise. The fourth instance matches a ripple on the absolute chart.
Figure 2: Relative mention volumes for “formula milk shortage” show possible controversies.
These articles provide an example of the content published around the times of those rises in mentions:
Analyzing the sentiment and polarity of the formula milk market
In short, the e-reputation of the formula milk market has been negative since the beginning of 2022 (see Figure 3). Positive sentiment drops and reflects the opposing negative sentiment almost exactly until May, when the news about the crisis breaks. Likewise, polarity trends downward over the same period.
Note: Polarity represents a company's aggregate of positive and negative sentiment (opinions, reviews), ranging from -1 to 1. A zero score means that there is as much positive as negative sentiment. High e-reputation brands can have polarity scores of more than 0.5.
Figure 3: “Formula milk market” sentiment analysis and polarity moved negatively over time
In the U.S., four brands produce the bulk of formula milk: Abbott, Mead Johnson, Nestlé, and Perrigo. Abbott and Nestlé hold the largest share of the formula milk market.
Figure 4: Abbott gains more than 75% of mention volume share in Q1 2022.
When we group these four brands' mentions from January 2021 to June 2022, we can see how their mention volumes compare (Figure 4). For example, at the beginning of the graph, we can see that Abbott and Nestlé have more mention-volume relative to their market share. However, at the end of 2021, Mead Johnson and Abbott experience spikes in mentions due to lawsuits against their formulas. Then, in Q1 2022, Abbott mentions increased drastically after its formulas were recalled due to possible contamination, taking more than 75% of the mention volume.
The baby formula market in the U.S. has been volatile for many reasons, which we won't get into in this article. However, this volatility could be seen and planned for. In this case, here are some tactics you can take to minimize your investment risks:
Employ a tool like SESAMm’s TextReveal to evaluate web data for insights into your investments. With premiere NLP technology, you can uncover sentiment and ESG insights about your industry, portfolio companies, or current investments.
Expand your research term for deeper insights. In this study, the term "formula milk market" had matching absolute and relative volumes. From this view, nothing looks out of place, and there aren't any red flags. However, when we expanded our research with the term "formula milk shortage," we found many controversies before the crisis gained national attention.
Dig into the controversies' causes. It's not enough to acknowledge a red flag. It would be best if you looked into what the potential reason is. Is the controversy caused by external factors or internal ones? Maybe both? Is the issue a one-time occurrence, or is it a pattern? So it's essential to avoid black-box tools. With solutions such as TextReveal that allow you to see beyond, you can access the underlying articles triggering the red flags.
Stay in touch with SESAMm
Thanks for reading this issue of Alternative Data Trends. Be sure to catch the next issue by subscribing to our blog. And if you'd like a TextReveal demo, send us a message via the form.
It’s a phrase that’s been thrown around for the last two or three decades—maybe too much in some cases. But it’s a short, catchy phrase. It sums up how we want to describe the amount of data we produce and have to deal with today.
To be clear, when we say “big data,” we mean big data analytics. It’s so much data that we can’t possibly grasp it in any human way, at least not reasonably. It’s coming from everywhere, growing exponentially, and coming at us faster and faster every day. In other words, the person-power it would take to process and analyze big data wouldn’t be feasible or affordable. So, we need help. We need data science. And we need a different type of intelligence: artificial intelligence. But more on that later.
Obviously, the use of big data comes with challenges. But big data initiatives are worth the cost and effort because what we can extract and analyze from it helps us understand the world and how it works at a macro-level. It also helps us dig into details and understand what’s happening at a micro-level. For example, businesses create lots of data in the Finance and Insurance industry. So extracting and analyzing big data can provide insights for investors when making investment decisions.
What is big data in finance?
Big data in finance is the immense amounts of diverse and complex data that banks, financial institutions, and investors use to understand consumer behavior, gain insight into possible investments, and create investment strategies. In other words, this data is primarily used by and for the financial services sector.
How big is big data anyway?
How big big data is depends on the amount of data being sourced, also known as data mining. If we were to consider how much data volume the world produces, it’s “at least 2.5 quintillion bytes of data” daily, according to CloudTweaks. That’s 2,500,000,000,000,000,000 bytes.
We usually measure big data—structured and unstructured data—in petabytes (PB) and terabytes (TB). A petabyte is 1024TB or a million gigabytes (GB). To put this amount of data into perspective, let’s use the newest iPhone as an example. Today’s iPhone can store up to 1TB of data. That means 1PB would equal the amount of data 1024 iPhones can store.
Other big-data challenges
Managing big data’s size is an obvious challenge, but big data comes with even more challenges. For example, any origin that produces or stores data can be a big data source, including social media. Thus, we often gather data from disparate sources.
Big data is also ever-growing. So in dealing with an ever-growing amount of data, we must ensure proper data processing, data management, and data integrity. Our data scientists, for instance, spend a good chunk of their time curating and preparing the data to make sure it’s valuable and clean.
Finally, after we’ve ensured data quality, we need AI to help us make sense of the data we’ve curated. In our case, we use natural language processing (NLP) to read more than 20 billion articles, messages, and forums to make sense of the textual data to enable our clients with multiple use cases, including signals for investment strategies, due diligences on private companies, and ESG controversy monitoring, among others.
How big data is used in the finance industry
Big data is used in many sectors and industries, and in some cases, it’s changing financial business models. However, big data technology has been used in the financial services industry in three key ways: to gain stock market insights, to detect and prevent fraud, and accurately analyze risk.
For instance, through machine learning—using computer algorithms to find patterns in massive amounts of data—data scientists can conduct a deeper data analysis in the financial markets beyond stock market data like stock prices, considering factors such as social and political trends. In some cases, this big data analysis can be provided in real time.
Machine learning also helps with fraud detection. It helps mitigate security risks through monitoring and analyzing customer data like buying patterns around credit cards, for example.
Further, machine learning helps with risk management. Investors can rely on machine learning’s unbiased output from alternative and financial data to predictive analytics, helping identify potential risks or great investment opportunities. Banks use these strategies to analyze business borrowers’ potential defaults, for example.
Other areas big data can provide a competitive advantage in the fintech industry:
Algorithmic trading
Chatbots and robotic process automation
Customer segmentation
Customer satisfaction
SESAMm leverages AI and big data for better investment decisions
SESAMm is a leading NLP technology company, and we serve global financial organizations, corporations, and investors, such as private equity firms, hedge funds, and other asset management firms. We provide datasets or NLP capabilities to enable our clients to generate their own alternative data for use cases, such as ESG and SDG, sentiment, private equity due diligence, corporation studies, and more. With access to SESAMm’s massive data lake, made up of more than 20 billion articles, forums, and messages, our clients can improve their decision-making process.
Request a TextReveal® demo to see how you can leverage big data for your investment decisions today.
Researching and analyzing investment opportunities can be challenging for asset management—private equity and hedge fund portfolio managers, researchers, and analysts—because, of course, you want to make sure that you're a good steward of your client's investments.
And when you find and source data, such as traditional or alternative data, you also want to make sure it's reliable and that the methods used to gather it are tried and true.
This article aims to give you an inside look into SESAMm's knowledge graph—one of the key reasons SESAMm's NLP-derived alternative data is reliable and trusted. We'll explain what a knowledge graph is, why it's important, how it works, and what makes SESAMm's knowledge graph unique.
What is a knowledge graph?
A knowledge graph is a digital representation of a network of real-world entities, the foundation of a search engine or question-answering service. This structured data model puts the schema in context through linking and semantic metadata, providing a framework for data integration, analytics, unification, and sharing. In other words, it's like a map and legend, with the legend labeling the concepts, entities, and events and the map connecting and identifying their relationships. These details are stored in a graph database and visualized as a graph representation, hence the term knowledge graph.
Fun fact: The expression, knowledge graph, gained popularity after Google used it in 2012 to name their semantic network.
Two types of knowledge graphs
There are two general types of knowledge graphs: open and private. Open knowledge graphs are open to the public. They're created and made available by organizations such as Wikidata, DBpedia, and Yago. Private knowledge graphs are often only used by organizations that create them, like Google, WolframAlpha, Facebook, and SESAMm (of course). Some offer them up for a fee or subscription, such as Crunchbase and OpenCorporates.
Why a knowledge graph is important
Knowledge graphs are important because they equip us with a model to see how everything relates from a big-picture view, creating new knowledge. Its benefits include:
Incorporating disparate data sources, avoiding data silos
From a data science and artificial intelligence (AI) perspective, knowledge graphs provide machine-readable details, adding context and depth to data-driven AI techniques such as machine learning. Using knowledge graphs and machine learning models together improves system accuracy and extends the range of machine learning capabilities for better explainability and trustworthiness.
How a knowledge graph works
The core of a knowledge graph is its knowledge model, a collection of interconnected descriptions of concepts, entities, events, and relationships known as an ontology. This model provides a framework for statements or taxonomy. Each statement consists of a subject, predicate, and object (Figure 1)—known as a triple model—and each subject or object is represented only once in the context of the other subjects and their relationships. For example, in this simple sentence, "The boy kicks the ball," The boy is the subject, and kicker is the predicate because he kicks the ball, the object.
Figure1: Apple is the subject, chief executive officer is the predicate, and Tim Cook is the object.
Likewise, each statement consists of three components: nodes, edges, and labels. A node, or vertice, represents an entity, which can be anything existing in the real world, such as a person, company, or object. For instance, in this example (Figure 2), Barack Obama is the subject node, Malia and Sasha are object nodes, and the edges, or relationships, are labeled as father or sibling, respectively.
Figure 2: How the relationships between nodes can be labeled.
What makes SESAMm's knowledge graph unique?
SESAMm uses open and private datasets with custom, curated information to create our proprietary knowledge graph. As a result, the knowledge graph is a vast map connecting and integrating over 70 million related entities and their keywords, relating each organization to its brands, products, associated executives, names, nicknames, and exchange identifiers in the case of public companies from a data repository made up of more than 18 billion articles and messages and growing.
The knowledge graph is updated regularly
Entities within the knowledge graph are updated weekly and tagged to ensure we correctly track their changes. For instance, the CEO of a company today might not be its CEO tomorrow. And brands might be bought and sold, changing the parent company with each sale. So, weekly updates within the knowledge graph ensure the system is aware of these changes.
NLP-driven accuracy
At SESAMm, named entity disambiguation (NED), a natural language processing (NLP) technique, identifies named entities based on their context and usage. Text referencing "Elon," for example, could refer indirectly to Tesla through its CEO or to a university in North Carolina. Only the context allows us to differentiate, and NED considers that context when classifying entities. This method is superior to simple pattern matching, which limits the number of possible matches, requires frequent manual adjustments, and can't distinguish homophones.
SESAMm uses three other NLP tools to identify entities and create actionable insights: lemmatization, embeddings, and similarity. The lemmatization process normalizes a word into its base form (morphology) to help identify and aggregate entities. Embedding assigns the entity a numerical value to help analyze how words change meaning depending on context and understand the subtle differences between words that refer to the same concept. Similarity measures whether two words, sentences, or objects are close to one another in meaning.
SESAMm tailored its knowledge graph to find, extract, and analyze data about public or private entities, which isn't readily available from the web or standard rating firms. This unique implementation of a knowledge graph provides insights to give you an edge when researching, analyzing, and submitting recommendations to the portfolio manager or clients.
SESAMm's premiere platform, TextReveal®, allows you to leverage NLP-driven insights fully and receive high-quality results through data streams, modular API and dashboard visualization, and signals and alerts. It's perfect for many quantitative, quantamental, and ESG investment use cases.
Learn how SESAMm can support you in your investment decision-making and request a demo today.
Sylvain Forté, CEO and co-founder of SESAMm, presented the following at Finovate 2022. In the presentation, Sylvain explains who SESAMm is, what SESAMm does, including examples, and how it benefits our financial clients.
Below is an approximation of this video’s audio content. Watch the video for a better view of graphs, charts, graphics, images, and quotes to which the presenter might be referring to in context.
Hi, everyone. Thank you very much for the opportunity to be with you today. I’m very glad to introduce you to SESAMm. I’m Sylvain, CEO and co-founder of SESAMm.
We’re an artificial intelligence company specializing in analytics for investment professionals and [corporations]. We basically extract billions of articles and messages from the web and transform them into actionable insights to make better decisions. We’re a team of close to 100 people now, and we generate insights from more than 20 billion articles and messages.
Immediate access to daily insights
Let me jump straight to the demo and give you a practical example of what we do. So imagine you’re, for example, a bank looking to compute environmental, social, and governance risks on your portfolio on your clients or on your suppliers. Right now, you may have access to ratings, which are updated once per quarter or once per year. We can give you access immediately to timely daily data on all of your companies in order for you to better assess risks and raise early warnings.
Wirecard use case
In this specific example (Figure 1), we look at Wirecard, a company that went bankrupt due to a 2 billion fraud scandal in Germany.
We extracted dozens of thousands of articles and messages on the company, and we can immediately see that there is a huge anomaly in terms of governance risk. The company is basically exposed to fraud accusations, to lawsuits, and the like, things that you don’t really want to see in your clients or your own portfolio.
Furthermore, we can see on this chart that we can get that type of indicator every single day. And we can see that six months prior to the company’s bankruptcy, there were already huge alerts actually here in January 2020, indicating that the company was in a pretty bad situation from the perspective of web content and web data from news to social platforms, blogs, and forums.
We really have the ability to compute live insights for ESG risk, sustainability monitoring, credit, and similar topics. The advantage of the platform is that we can go very deep. You can see here (Figure 2) some of the underlying governance topics associated with Wirecard, such as fraud, embezzlement, and crime—the main accusation—but also things related to anti-competitive practices or corruption.
Figure 2: Underlying governance topics associate with Wirecard.
And furthermore, the platform enables full transparency. This is AI at scale, but the underlying content is actually text articles and messages that you can read in order to understand the situation and see why the company is in that risk position. So with our platform, with our text analysis engine (TextReveal®), you can immediately extract content on your portfolio, your clients, your suppliers, and for example, generate ESG insights, competitive insights, sentiment insights, or credit warnings, for example.
Trusted, reliable, and abundant insights
We are today trusted by major financial institutions, such as Nomura [Holdings] or Raiffeisen Bank in the banking sector, for example, or large private equity firms worldwide. The reason why they trust us is that we can provide data more quickly—so waiting one day instead of waiting three months—to get an indicator. In addition to that, we have better coverage. We’re the only company in the world that can provide information on five million different public and private companies, meaning all of your banking clients, for example, are covered. And finally, we have access to a large variety of sources, from social content to news and blogs.
Insights beyond companies
Another example that is very common—sadly right now—is clients asking us to follow the Ukraine Russia War and to understand the current situation, including by getting access to local content in local languages in Ukrainian, in Polish, in Russian, to really understand the news and social media out there.
You can see here that beyond companies, we actually track sectors, infrastructure projects, and concepts.
Figure 3: A dashboard view into Nord Stream in the context of Ukraine.
Here (Figure 3), Nord Stream, for example, in the context of Ukraine specifically—so as to understand how these two topics are associated on the web—we can see an explosion in terms of volumes of data over time, the news associating this concept more and more, with more than 40,000 pieces of content. And we can see that sentiment over time, as displayed on this curve (Figure 4), decreases very rapidly, so we see the shock on e-reputation, and we can observe that immediately. And, for example, as a bank or as an asset manager, we can use that to assess the potential risk to clients or portfolio companies.
The interesting thing here is that, beyond the graphs and the raw contents, we can look at where the information comes from. Here (Figure 5), you see a lot of information in German, for example, which is not surprising. And you can even follow the Russian propaganda directly from the platform, looking at Russia Today or Sputnik straight from the engine, as these are also sources that we monitor.
Figure 5: The dashboard on Nord Stream shows sources from Germany and Russia.
And as you can see, these contents are highly customizable and can be used in very specific situations. So this is really a platform as a service (PaaS) that we offer. This is an engine that tracks four million different sources of information, and we can track millions of companies but also even fuzzy concepts, countries, or topics of interest.
Generate analytics from big data with API
One last thought. A lot of our clients integrate with our API; it’s a technical solution. We work a lot with data science teams, data engineering teams, risk teams, quantitative analysts, and heads of innovation. All of these teams are looking to generate analytics from big data and from web content at scale, with solutions that are currently used by dozens of clients worldwide and for which we provide very relevant analytics.
I’ll leave you with three final calls to action.
The first one is come see us at our booth. We would be very happy to present the solution in a bit more detail.
The second is, please request a demo. You understand that these indicators can be tailored to your needs in real time. So we’ll be very happy to show you a demo at SESAMm.com.
And finally, come see us for a free proof-of-concept (POC). We would be very happy to show you how we incorporate these solutions in actual banking tools and in risk management tools.
So the web is now readily available as a system that you can use and that you can rely on in order to generate valuable insights. We’re very happy to provide the solution to the market and to help inform better decisions and to help monitor risks.
Financial and ESG insights begin with big data coupled with data science.
At SESAMm, our artificial intelligence (AI) and natural language processing (NLP) platform analyzes text in billions of web-based articles and messages. It generates investment insights and ESG analysis used in systematic trading, fundamental research, risk management, and sustainability analysis.
This technology enables a more quantitative approach to leveraging the value of web data that is less prone to human bias. It addresses a growing need in public and private investment sectors for robust, timely, and granular sentiment and environment, social, and governance (ESG) data. This article will outline how the data is derived and illustrate its effectiveness and predictive value.
Content coverage and ESG data collection
The genesis of SESAMm’s process is the high-quality content that comprises its data lake, the source from which it draws its insights. SESAMm scans over four million data sources rigorously selected and curated to maximize coverage of both public and private companies. Three guiding criteria—quality, quantity, and frequency—ensure a consistently high input value.
Every day the system adds millions of articles to the 16 billion already in the data lake, going back to 2008. The coverage is global, with 40% of the sources in English (the U.S. and international) and 60% in multiple languages. The data lake, expanding every month, comprises over 4 million sources, including professional news sites, blogs, social media, and discussion forums.
The following tables illustrate SESAMm’s data lake distribution (Q1 2022):
Respect for personal privacy figures highly in the data gathering process. We don’t capture personal data, like personally identifiable information (PII), and respect all website terms of service and global data handling and privacy laws. SESAMm’s data also doesn’t contain any material non-public information (MNPI).
Deriving financial signals and ESG performance indicators
SESAMm’s new TextReveal® Streams platform applies NLP and AI expertise to process the premium quality content gathered in its data lake. This complex process involves named entity recognition (NER) and disambiguation (NED)—the process of identifying entities and distinguishing like-named entities using contextual analysis—and mapping the complex interrelationships between tens of thousands of public and private entities, connecting companies, products, and brands by supply chain, location, or competitive relationship.
Process representation for NER and NED
Using SESAMm’s TextReveal Streams, this wealth of information is filtered to focus on four crucial contexts for systematic data processing, risk management, and alpha discovery:
Sentiment covering major global indices: world equities (and Small Caps, Emerging), U.S. 3000, Europe 600, KOSPI 50, Japan 500, Japan 225
Sentiment covering all assets and derivatives traded on the Euronext exchange
Private company sentiment on more than 25,000 private companies
ESG risks covering 90 major environmental, social, and governance risk categories for the entire company universe, which includes more than 10,000 public and more than 25,000 private companies with worldwide coverage
TextReveal Streams data sets and assessments are used by financial institutions, rating agencies, and the financial services sector, such as hedge funds (quantitative and fundamental) and asset managers, to optimize trade timing and identify new sustainable investment opportunities. Private equity deal and credit teams also use the data for deal sourcing and due diligence. Private equity ESG teams use it to manage initiatives like portfolio company environmental, social, and governance risk and reporting.
Methodology and technology for processing unstructured data
NLP workflow, from data extraction to granular insight aggregation
Data is continually extracted from an expanding universe of over four million sources daily. As it enters the system, it is time-stamped, tagged, indexed, and stored in our data lake to update a point-in-time history extending from 2008 to the present. The source material is then transformed from raw, unstructured text data into conformed, interconnected, machine-readable data with a precise topic.
NLP workflow for TextReveal Streams
Mapping relationships between entities with the Knowledge Graph
At the heart of the text analytics process is SESAMm’s proprietary Knowledge Graph, a vast map connecting and integrating over 70 million related entities and their keywords. It’s essentially a cross-referenced dictionary of keywords, relating each organization to its brands, products, associated executives, names, nicknames, and their exchange identifiers in the case of public companies.
Entities within the Knowledge Graph are updated weekly and tagged to ensure changes are correctly tracked. The CEO of a company today, for example, may not be the CEO tomorrow, and brands may be bought and sold, changing the parent company with each sale. Weekly updates within the Knowledge Graph ensure the system is aware of these changes.
Named entity disambiguation (named entity recognition plus entity linking) is one of the NLP techniques used to identify named entities in text sources using the entities mapped within the Knowledge Graph universe.
At SESAMm, NED identifies named entities based on their context and usage. Text referencing “Elon,” for example, could refer indirectly to Tesla through its CEO or to a university in North Carolina. Only the context allows us to differentiate, and NED considers that context when classifying entities. This method is superior to simple pattern matching, limiting the number of possible matches, requiring frequent manual adjustments, and cannot distinguish homophones.
SESAMm uses three other NLP tools to identify entities and create actionable insights. These are lemmatization, embeddings, and similarity. Each is explained in more detail below.
Analyzing the morphology of words with lemmatization
News articles, blog posts, and social media discussions reference organizations and associated entities in various forms and functions. Lemmatization seeks to standardize these references so the system knows they mean the same thing.
For example, “Tesla,” “his firm,” “the company,” and “it” are all noun phrases that can appear in a single article and refer to a single entity. Even where the reference is apparent, it can take different forms. For example, “Tesla” and “Teslas” both refer to the same entity but have slightly different meanings (semantics) and shapes (morphology).
The lemmatization process standardizes reference shape (morphology) to facilitate identification and aggregation. Lemmatization is a more sophisticated process than stemming, which truncates words to their stem and sometimes deletes information.
Encoding context and meaning with word embedding
In NLP, embedding is a numerical representation of a word that enables its manifold contextual meanings to be calculated relationally. Embeddings are typically real-valued vectors with hundreds of dimensions that encode the contexts in which words appear and, thus, also encode their meanings. Because they are vectors in a predefined vector space, they can be compared, scaled, added, and subtracted. An example of how this works is that the vector representations of king and queen bear the same relation to each other as the representations of man and woman once you subtract the vector that represents royal.
Vectorized representation of embeddings
Using embedding is key to analyzing how words change meaning depending on context and understanding the subtle differences between words that refer to the same concept: synonyms. For example, the words business, company, enterprise, and firm can all refer to the same thing if the context is “organizations.” But they represent different things and even different parts of speech if the context changes.
In the phrase, “[Tesla] will be by far the largest firm by market value ever to join the S&P,” for example, one could replace the word firm with company or enterprise without affecting the meaning significantly. Contrast that with “a firm handshake,” where a similar substitution would render the phrase meaningless.
Also, words referring to the same concept can emphasize slightly different aspects of the concept or imply specific qualities. For example, an enterprise might be assumed to be larger or to have more components than a firm. Embeddings enable machines to make these subtle distinctions.
One advantage of using embedding is that it’s practical because it’s empirically testable. In other words, we can look at actual usage to determine what a word means.
Another advantage is that embeddings are computationally tractable. This understanding of a word’s definition allows us to transform words into computation objects to programmatically examine the contexts in which they appear and, thus, derive their meaning.
As lemmatization is an improvement on stemming, embeddings improve techniques such as one-hot encoding, which is close to the common conception of a definition as a single entry in a dictionary.
SESAMm uses the global vectors for word representation (GloVe) algorithm to generate embeddings. It’s an unsupervised learning algorithm that begins by examining how frequently each word in a text corpus co-occurs with other words in the same corpus. The result is an embedding that encapsulates the word and its context together, allowing SESAMm to identify specific words in a list and different forms of the listed words and unlisted synonyms.
GloVe is an extension of recent approaches to vector representation, combining the global statistics of matrix factorization techniques like latent semantic analysis (LSA) with the local context-based learning of word2vec. The result is an unsupervised algorithm that performs well at capturing meaning and demonstrating it on tasks like calculating analogies and identifying synonyms.
BERT is another algorithm used by SESAMm to generate embeddings. BERT produces word representations that are dynamically informed by the words around them. Google developed the technique, and it’s what’s known as a transformer-based machine learning technique, which means it doesn’t process an input sequence token by token but instead takes the entire sequence as input in one go. This technique is a significant improvement over sequential recurrent neural network (RNN) based models because it can be accelerated by graphics processing units (GPUs).
SESAMm uses BERT for multilingual NLP of its extensive foreign language text because it has been retained using an extensive library of unlabeled data extracted from Wikipedia in over 102 languages. BERT model was trained to predict words from context and next sentence prediction where it was trained to predict if a chosen following sentence was probable or not given the first sentence. As a result of this training process, BERT learned contextual embeddings for words. Due to this comprehensive pre-training, BERT can be finetuned with fewer resources on smaller datasets to optimize its performance on specific tasks.
Linking words, sentences, and topics with cosine similarity
Cosine similarity with centered means it’s identical to the correlation coefficient, which highlights another element of the computational tractability of the embeddings approach. It makes it easy to compare words and contexts for similarity.
Converting words to vector representations means we can quickly and easily compare word similarity by comparing the angle between two vectors. This angle is a function of the projection of one vector onto another. It can identify similar, opposite, or wholly unrelated vectors, which allows us to compute the similarity of the underlying word that the vector represents.
Two vectors aligned in the same orientation will have a similarity measurement of 1, while two orthogonal vectors have a similarity of 0. If two vectors are diametrically opposed, the similarity measurement is -1. In practice, negative similarities are rare, so we clip negative values to 0.
Vectorized representation of cosine similarities
Cosine similarity measures whether two words, sentences, or corpora are close to one another in vector space or “about” the same thing in semantic space. To answer the question, “Is this sentence referencing company X?” we embed the sentence using the process described above and compute the cosine similarity between the sentence and the embedded company profile. Analogously, we compute similarities between sentences and the ESG topics SESAMm monitors by taking the maximum similarity between a sentence and each embedded keyword associated with an ESG topic.
These similarities allow us to identify whether a sentence references fraud, tax avoidance, pollution, or any other ESG risk topic among the more than 90 that SESAMm tracks across the web.
Similarities within ESG topics combine with word counts to resolve the recall and precision problem. Word counts are precise because if a word is identified within a context, then that context, by construction, references the topic.
The virtue of using these NLP techniques is that even if a given keyword list does not include every possible combination of words that a person might use to discuss a topic, relevant entities missed by the word-count process will be identified through vector similarity.
This is the power of SESAMm’s NLP expertise. We can scan many lifetimes’ worth of data in seconds to find the concepts you explicitly ask for and the concepts relevant to your search but that you did not think of yourself.
Sentiment analysis with deep learning and neural networks
Once we’ve identified the concepts and contexts of interest in all the forms they appear, we analyze the context to determine the speakers’ attitudes.
We use sentiment classification models to score a sentence with three possible outcomes: negative, neutral, or positive. The current classification models are based on deep learning AI technologies. Specifically, we stack convolutional neural networks with word embeddings and bayesian optimized hyperparameters—parameters not learned during training. This architecture improves the accuracy and enables fast shipping of production-ready models for a given language. We also produce state-of-the-art frameworks with architecture variations enabling multilingual capabilities, such as transformers and universal sentence encoders.
Condensing information and extracting insights with daily aggregation
Similarities, embedded word counts, and sentiment are state-of-the-art tools for processing unstructured text data. The same tools are effective cross-linguistically.
Once the information has been extracted from millions of data points, it’s aggregated and condensed into actionable insights.
All entities are referenced directly or indirectly within an article. Then, sentence-level references are aggregated to obtain an article-level perspective, and finally, all relevant articles are aggregated to gain an entity-level view of that day.
In this way, reams of data are compressed into several metrics to provide a daily aggregate view for each entity, highlighting trends at a sentence, article, and entity-level comparable over a multi-year history.
ESG analysis use cases
SESAMm’s TextReveal Streams is used in various investment domains, from asset selection to alpha generation and risk management. Systematic hedge funds track retail interest in real time to identify investment opportunities and protect their existing positions. In the Private Equity industry, equity and credit-deal teams use the data in various ways, from monitoring consumer perspectives via forums and customer reviews for evaluating deal prospects to estimating due diligence risks, all to help make investment decisions. Dedicated teams use our data for monitoring portfolio companies for ESG red flags that conventional ESG reporting might miss.
Below are two examples of how aggregated TextReveal Streams data can be used to help identify investment risk and opportunity.
LFIS CapitalL: ESG signals for equity trading
ESG controversies can significantly impact asset prices in the short term, and it’s now estimated that intangible assets, including a company’s ESG rating, account for 90% of its market value.
Working in partnership with LFIS Capital (LFIS), a quantitative asset manager and structured investment solutions provider, SESAMm developed machine learning and NLP algorithms that could analyze ESG keywords in articles, blogs, and social media, to generate a daily ESG score specific to each stock, which is part of the TextReveal Streams’ platform’s core functionality.
The results were promising when these scores were incorporated into a simulated strategy for trading stocks in the Stoxx600 ESG-X index.
A simulated long-only strategy running between 2015 and 2020, using the signals, delivered a 7.9% annualized return, 2.9% higher than the benchmark for similar annualized volatility (17.3% vs. 17.1%). The information ratio of the strategy was greater than 1, with a tracking error of 2.8%. Results for the previous three years were compelling, reflecting the growing interest and news flow around ESG themes.
Researchers also backtested a hypothetical long-short strategy for all stocks in the Stoxx600 ESG-X index with a market cap of over $7.5bn. This investment strategy delivered a Sharpe ratio of approximately 1 with annualized returns and volatility of 6.1% and 5.9%, respectively, between 2015 and 2020. Like the long-only strategy, returns were particularly robust over the three years up to 2020: +6.0% in 2018, +7.3% in 2019, and +11.3% in 2020.
Finally, a simulated “130/30” ESG strategy that combined 100% of the long-only ESG strategy and 30% of the long-short ESG strategy delivered a 10.8% annualized return, 5.8% higher than that of the Stoxx600 ESG-X index. Annualized volatility was similar at 16.9% vs. 17.1%. The strategy experienced a tracking error of 3.8% and an information ratio of over 1.5, with a consistent outperformance each year.
Disclaimer: Past performance is not an indicator of future results. Theoretical calculations are provided for illustrative purposes only. The investment theme illustrations presented herein do not represent transactions currently implemented in any fund or product managed by LFIS.
Wirecard: ESG sentiment and volume as predictive indicators
The Wirecard scandal broke on June 21, 2020, when newswires carried the story that the major German payment processor had filed for bankruptcy after admitting that €1.9 billion ($2.3 billion) of purported escrow deposits did not exist.
Could SESAMm’s TextReveal Streams platform have provided investors with an early warning that the scandal was about to break?
The following chart derived from the platform shows how key ESG metrics, including ESG scores (volumes) and ESG scores (sentiment), reacted to the news.
An analysis of the charts pinpoints a shallow rise in the ESG scores (volumes) time series in the early part of June before the eruption on June 21.
The ESG scores (sentiment) metric also shows a steady increase in negative sentiment for governance, the most relevant of the three ESG factors regarding the scandal.
How key ESG metrics, including ESG scores (volumes) and ESG scores (sentiment), reacted to the Wirecard scandal news.
Additionally, before the crash, governance was the most negative of the three ESG factors most of the time. This was especially the case from late March to early April, and then before the scandal in early June, negative governance sentiment diverged higher from the other two.
The rate-of-change of negative governance sentiment as it rose and peaked in early June before the scandal broke was also extremely high, perhaps providing the basis for an early warning signal.
Portfolio managers who had been keeping an eye on the reputational slide in Governance for Wirecard may have decided the company was at high risk of a negative controversy emerging, giving them cause to drop the stock before the event.
In this way, it can be seen how while not providing a hard and fast early warning signal, SESAMm’s ESG scores can, nevertheless, be used as the basis for developing a data-driven, rules-based portfolio management approach that can help investors avoid high-risk candidates like Wirecard.
SESAMm takes on ESG data challenges
SESAMm’s NLP and AI tools analyze over four million data sources daily to identify thousands of public and private companies and their related products, brands, identifiers, and nicknames, turning reams of unstructured text into structured and actionable data.
SESAMm’s TextReveal Streams platform can be used in many quantitative, quantamental, and ESG investment use cases. TextReveal is a solution that allows you to fully leverage NLP-driven insights and receive high-quality results through data streams, modular API and dashboard visualization, and signals and alerts.
Learn how SESAMm can support you in your investment decision-making and request a demo today.
To request a demo or for access to the full SESAMm Wirecard or LFIS reports, contact us here:
It's a word that most of us in the U.S. despise, almost as much as the word taxes. It's probably because, like taxes, we can't escape its wallet-draining effect when it increases. Maybe the way we feel about it is because the last time the U.S. economy deflated—giving us relief from it—was in the 1930s, when "Prices dropped an average of nearly 7% every year between the years of 1930 and 1933," according to Investopedia. But I digress.
We won’t go into how inflation works, but how the government calculates it—and how its categories affect it—has always been consistent. At least it was until the COVID-19 pandemic hit, that is.
What NLP text mining reveals about the U.S. economy inflation-rate factors and the online conversations about them
To ensure we're on the same page about how we came to the forthcoming information in this use case, let's cover a couple of basics on NLP text mining and inflation rate indexes.
What are NLP and text mining?
Natural language processing (NLP), an A.I. technology, automates the data analysis of mined textual, unstructured data. It includes natural language understanding and natural language generation to simulate a human’s ability to create language, and it’s a component of text mining that performs a special kind of linguistic analysis by deep learning algorithms so a machine can “read” text. Apps like Grammarly or Wordtune analyze text to improve a written text, for example, and chatbots use this technology to interact with customers. Text mining, or text analytics, is the process of examining big data document collections. It’s a computer science discipline that converts unstructured text data in documents and databases into normalized, structured data and datasets for analysis by machine learning models. Deep learning machine-learning algorithms then analyze this data, analyzing semantics and grammatical structures, to gain new insight or aid research from human language. Together, NLP and text mining are like a search engine on steroids.
The Consumer Price Index (CPI)
According to this Forbes Advisor article, "The two most frequently cited indexes that calculate the inflation rate in the U.S. are the Consumer Price Index (CPI) and the Personal Consumption Expenditures Price Index (PCE)." For this article, however, we'll only use the Bureau of Labor Statistics (BLS) method of CPI inflation calculation as a reference. CPI observes a specific group of commonly-purchased goods and services to gauge how prices fluctuate. These foods and services include:
Apparel: Women's and men's clothes, jewelry, etc.
Alcoholic beverages: Beers, wine, liquor, etc.
Energy and commodities: Gasoline, natural gas, electricity, etc.
Food: Items bought by the average consumer, such as breakfast cereal, milk, meat, fruits, vegetables, etc.
Housing and shelter: Rent, housing insurance, bedroom furniture, hotel or motel accommodation costs, etc.
Medical care services: Physicians' services, prescription drugs, medical supplies, etc.
New and used vehicles: Trucks, vans, sedans, SUVs, etc.
Tobacco and smoking products: Tobacco-related items, such as cigarettes, cigars, bidis, kreteks, loose tobacco, etc.
Transportation services: Airline fares, vehicle insurance, etc.
NLP text-mining process: web mentions matched to CPI categories
Using SESAMm's web text analysis engine TextReveal®, we analyzed textual data relating to the inflation topic within the U.S. from 2017 until now. For this analysis, we defined co-mentions as the articles and social media posts that mention "inflation" and at least one of the CPI categories. Note: Although we can analyze more than 100 languages, we focused on English in this case. Also, we didn’t conduct a sentiment analysis from the information extraction.
Figure 1: Inflation co-mentions by category and percentage.
From 2017 to 2019, inflation co-mentions within the U.S. are relatively stable (see Figure 1). But this trend changes with the first shift in 2020, continuing its rapid growth and peak by the end of 2021 due to this surge of inflation reaching record levels.
What was one of the main drivers of the inflation surge? Used cars.
3 used-car and inflation trends uncovered through NLP Text Mining
According to the U.S. Bureau of Labor Statistics, the cost of used vehicles was one of the main drivers of the inflation spike. How did used cars contribute to inflation? The chain of events occurred like so: The increased used-car demand was fueled by a new-vehicle supply shortage caused by a chip shortage generated by supply-chain interruptions due to the COVID-19 pandemic.
As the pandemic-induced supply-chain interruption unfolded, used-car trends developed. Here are three we found in our data mining research:
Trend 1: Co-mentions percentage for used vehicles more than doubled
Figure 2: Used vehicles co-mentions increase percentage-wise.
Based on the percentage of co-mentions compared to other topics, the used-car topic moves from the number eight spot to the number four spot in 2021 (see Figure 2).
Figure 3: Used-car co-mentions begin in early 2021 and exceed those for new cars.
Before 2020, mentions were relatively steady. However, we observe an increase in used-vehicles mentions caused by disruptions in supply chains leading to chip shortages (see Figure 3) as early as January 2020. These shortages led to a decrease in new vehicle inventory. The Statista report, indicating an increase of the used vehicle value index by 49 points compared to the price index recorded in 2020, supports our findings.
Trend 2: Used vehicle prices rose with used-car co-mentions
Figure 4: In 2020, inventory spikes as production and sales plummet, affecting inflation.
Because of the pandemic, car production nearly stopped along with the sale of cars, which created two situations: 1. high inventory to sales ratio and 2. historically low car production (see Figure 4). Vehicles sales picked up later, but car production was still suffering because of supply-chain disruption. That meant the inventory to sales ratio dropped to virtually zero.
So consumers with little-to-no options for new vehicles turned to used cars, increasing their demand and therefore increasing their prices. We confirm this hypothesis with increasing mentions within the used-vehicles topic, coinciding with an inventory volume decrease. All in all, used-vehicle prices rose 40.5%.
Trend 3: The COVID-19 pandemic and new vehicle inventory shortage increased demand
A smaller new-vehicle inventory wasn't the only reason consumers sought out used vehicles. They also wanted used cars because of the pandemic.
Figure 5: The pandemic and new-vehicle supply shortage became bigger reasons for consumers to seek out used cars over cost.
For 2020, we observe that consumers avoided public transportation by rising co-mentions between pandemic-related mentions and the demand for secondhand vehicles (see Figure 5).
Used-car and inflation trends summary
We can summarize the used-car and inflation trends with one phrase: It's a used-car seller's market. For example, online retailers like Carvana have leveraged these factors to grow significantly. In contrast, due mainly to significant supply chain disruptions, motor companies have had the opposite effect, with the Automotive industry projected to lose $210 Billion. Judging by the number of mentions in public web forums and social media, the chip shortage and used-car boom affected General Motors, Ford, and Toyota the most (see Figure 6).
Figure 6: General Motors, Ford, and Toyota suffered pandemic-related shortages the most based on co-mentions.
About SESAMm and TextReveal’s® NLP Text-mining Capabilities
SESAMm is a leading company in alternative data and artificial intelligence, delivering global investment firms and corporations descriptive, prescriptive, or predictive investment analytics worldwide. TextReveal is SESAMm's premiere NLP text-mining product, a solution that allows you to fully leverage NLP-driven insights and receive high-quality results through data streams, modular API and dashboard visualization, and signals and alerts. In other words, we organize, categorize, and capture relevant information from raw data for you.



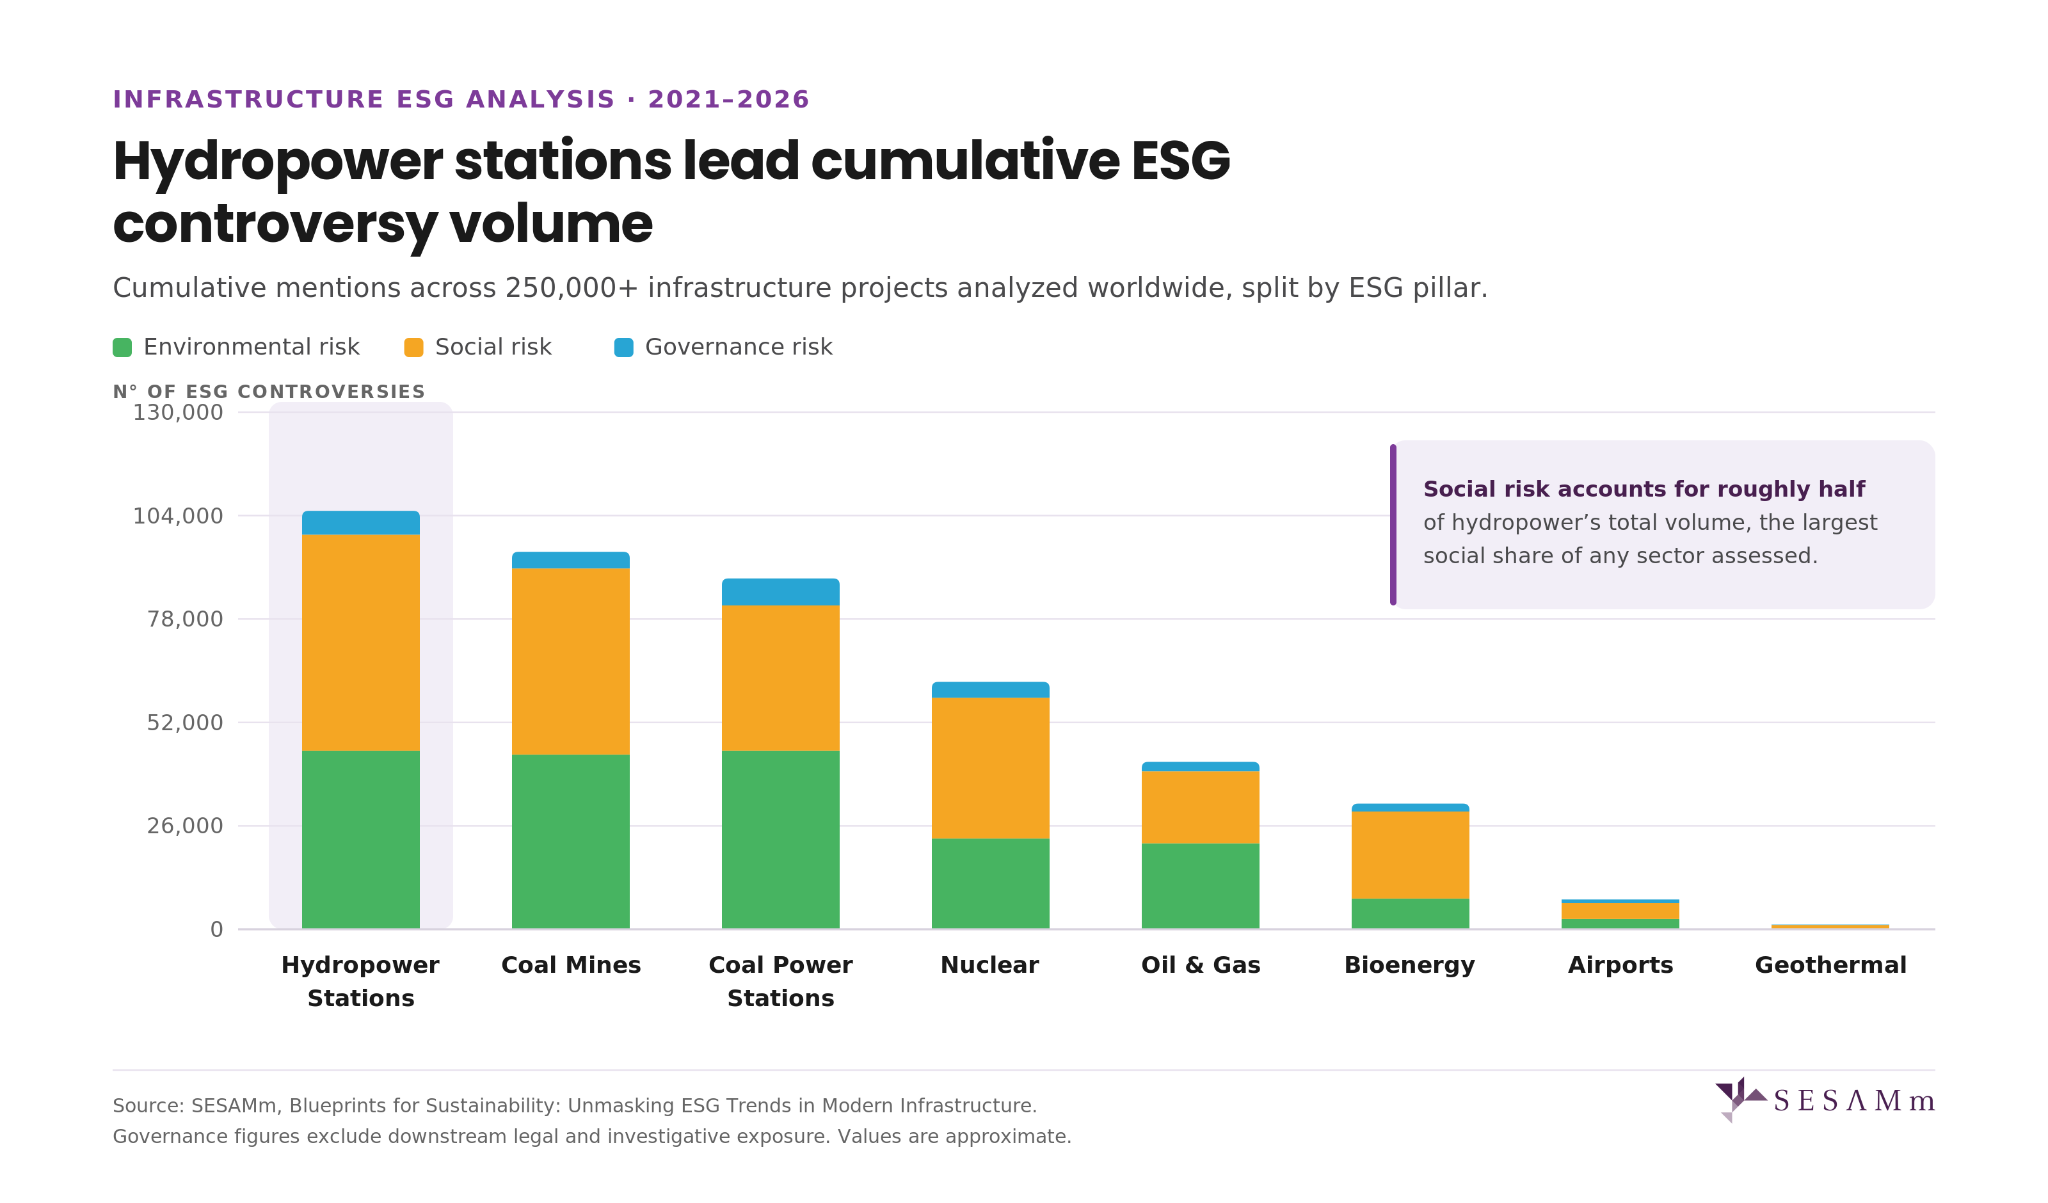


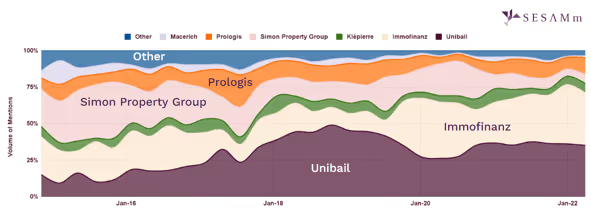
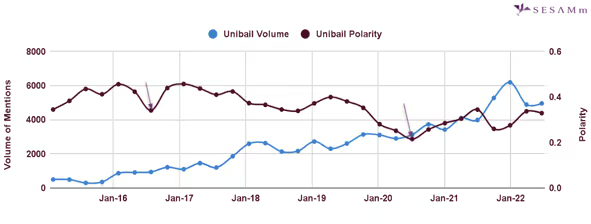
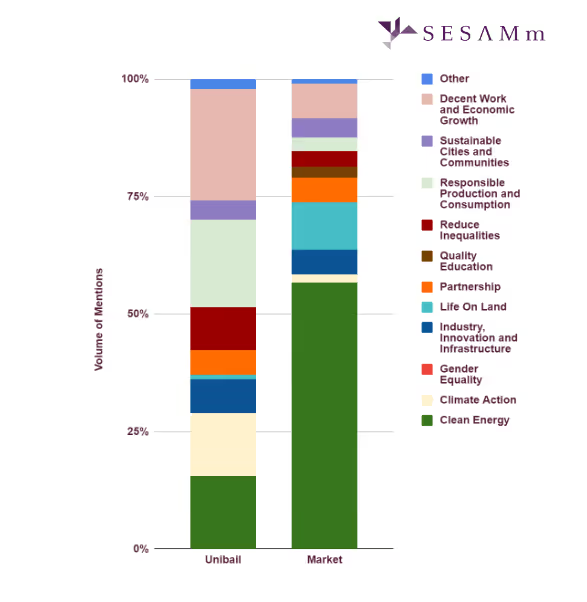

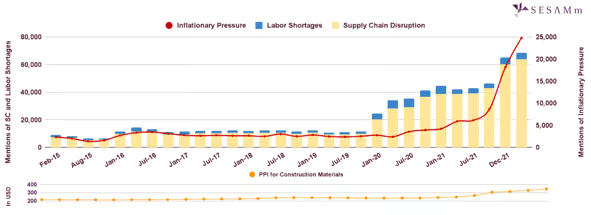
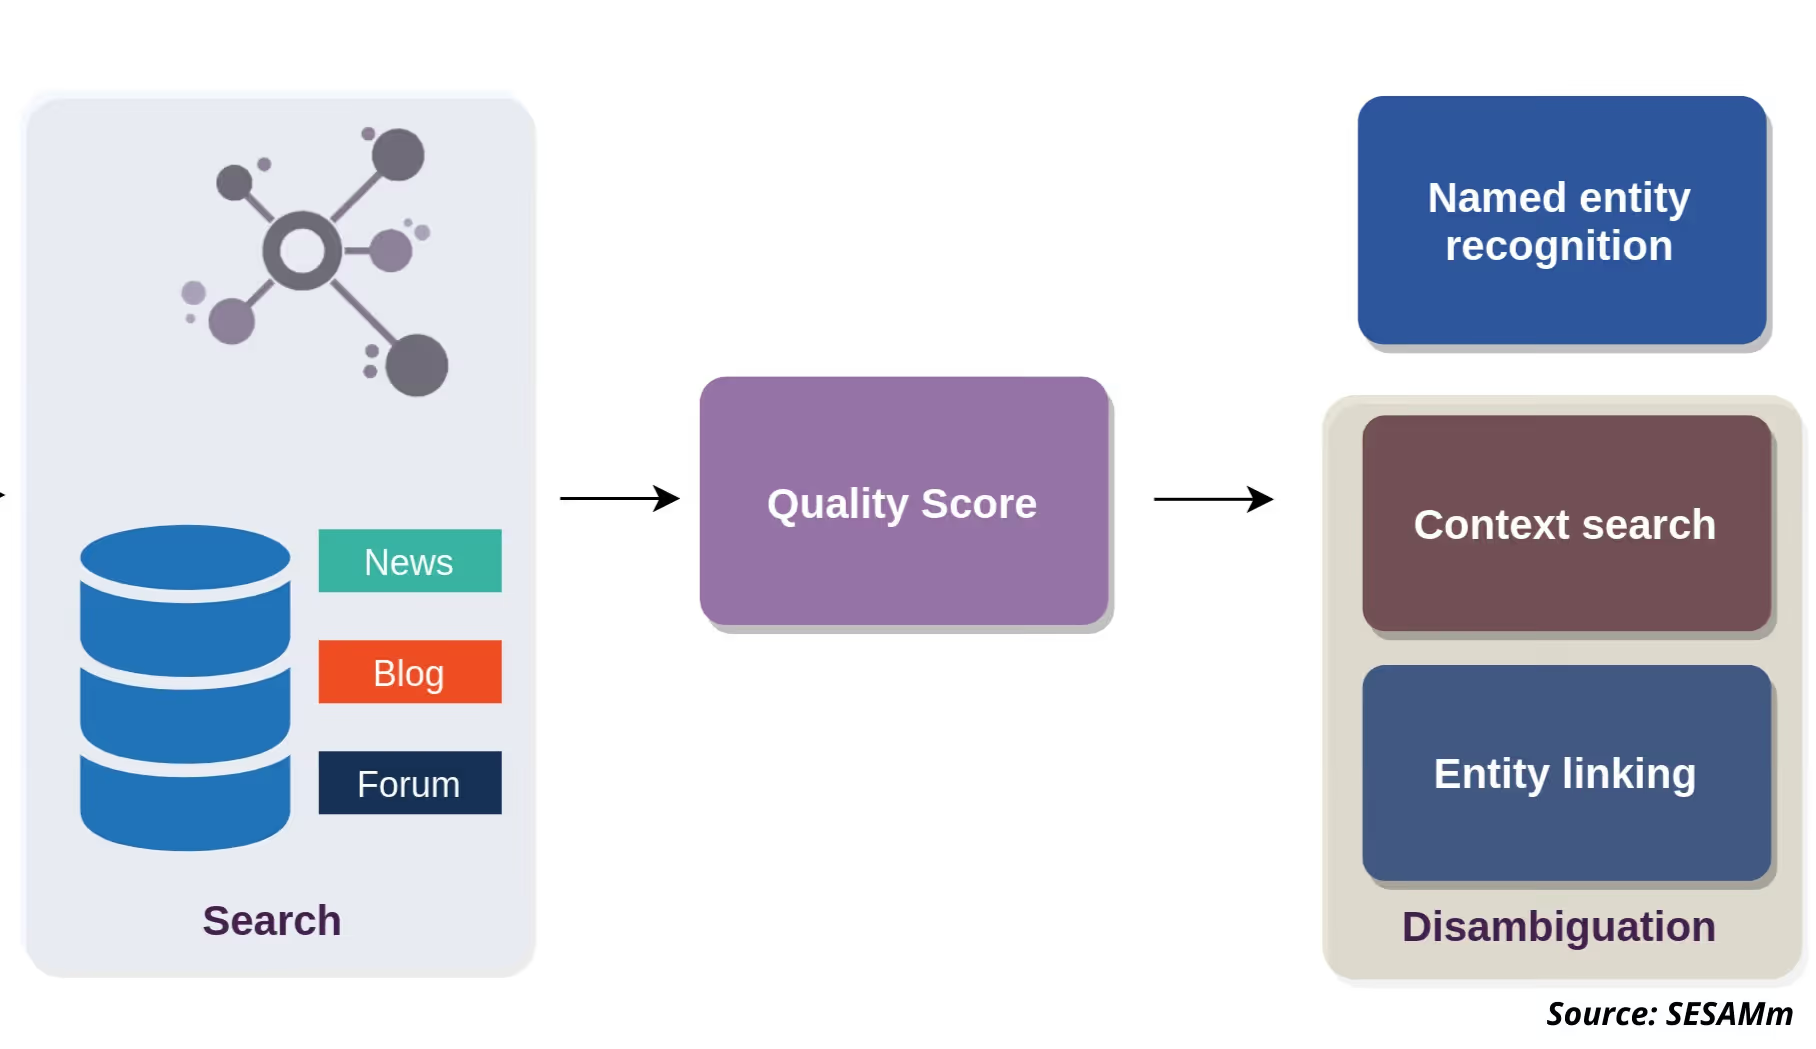
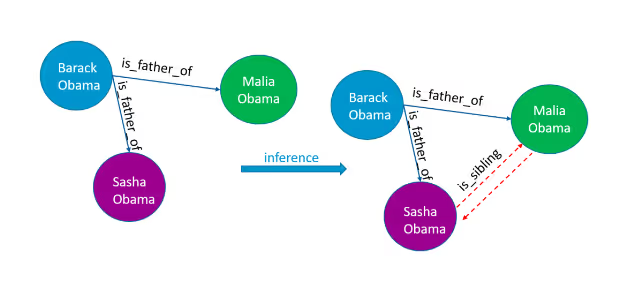

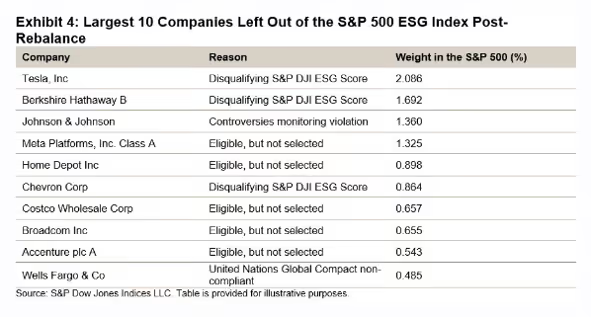
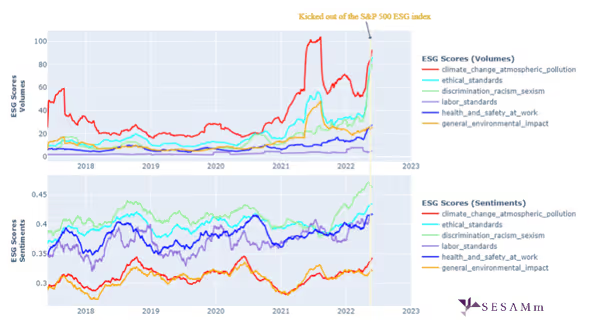
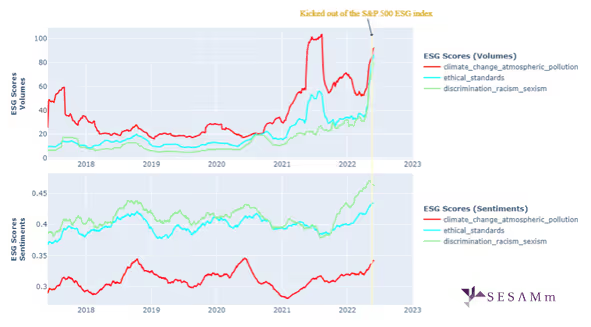
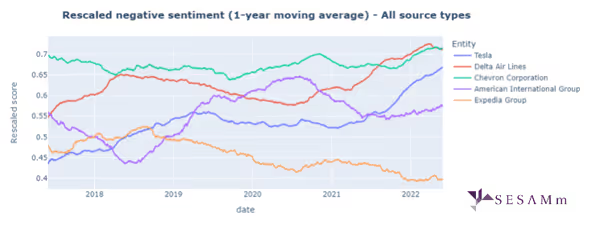
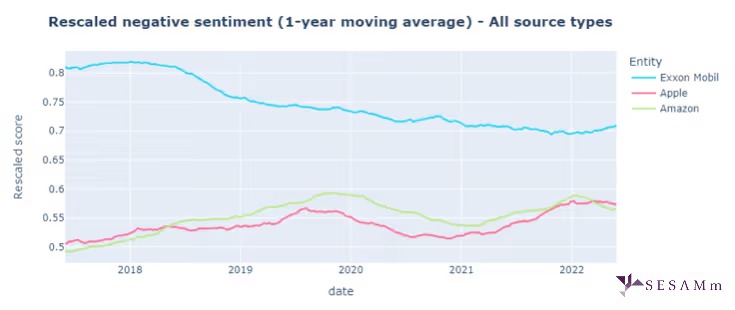


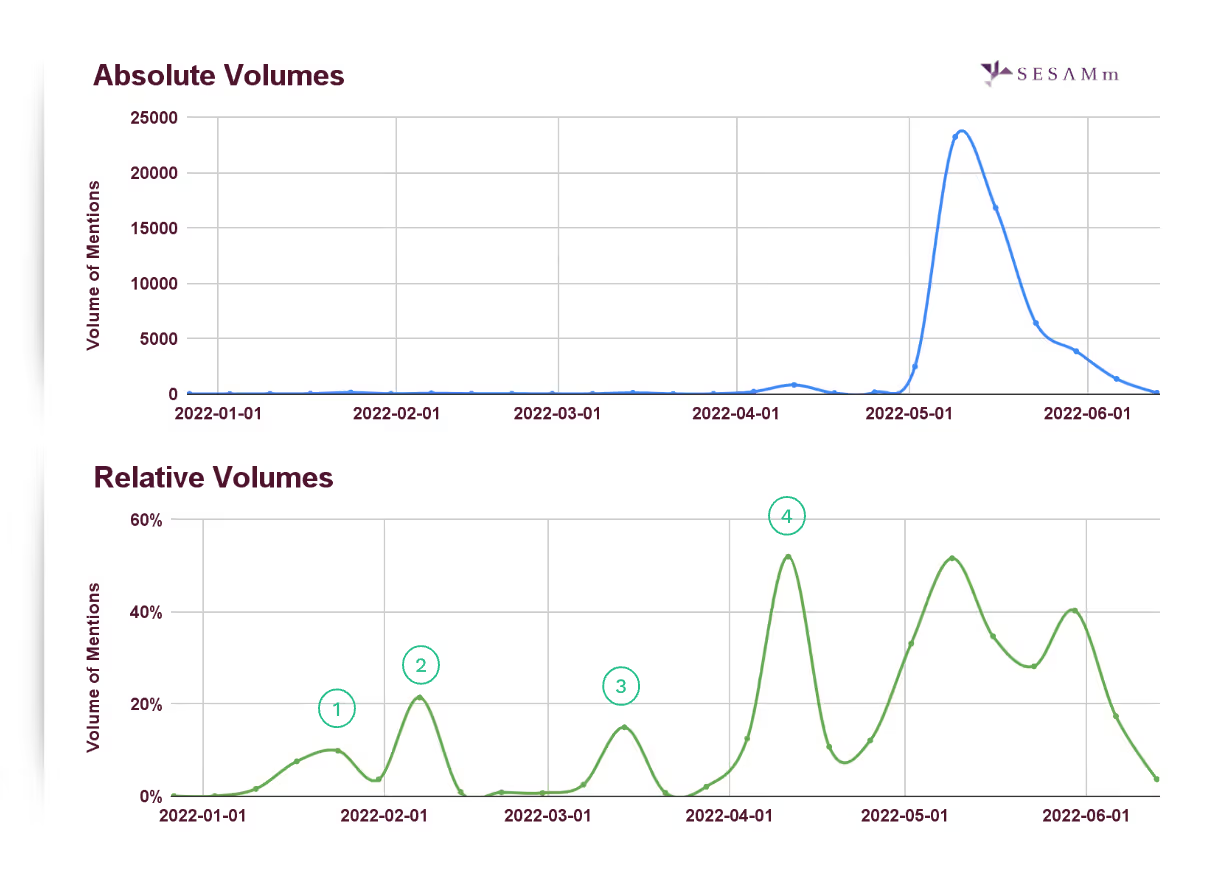
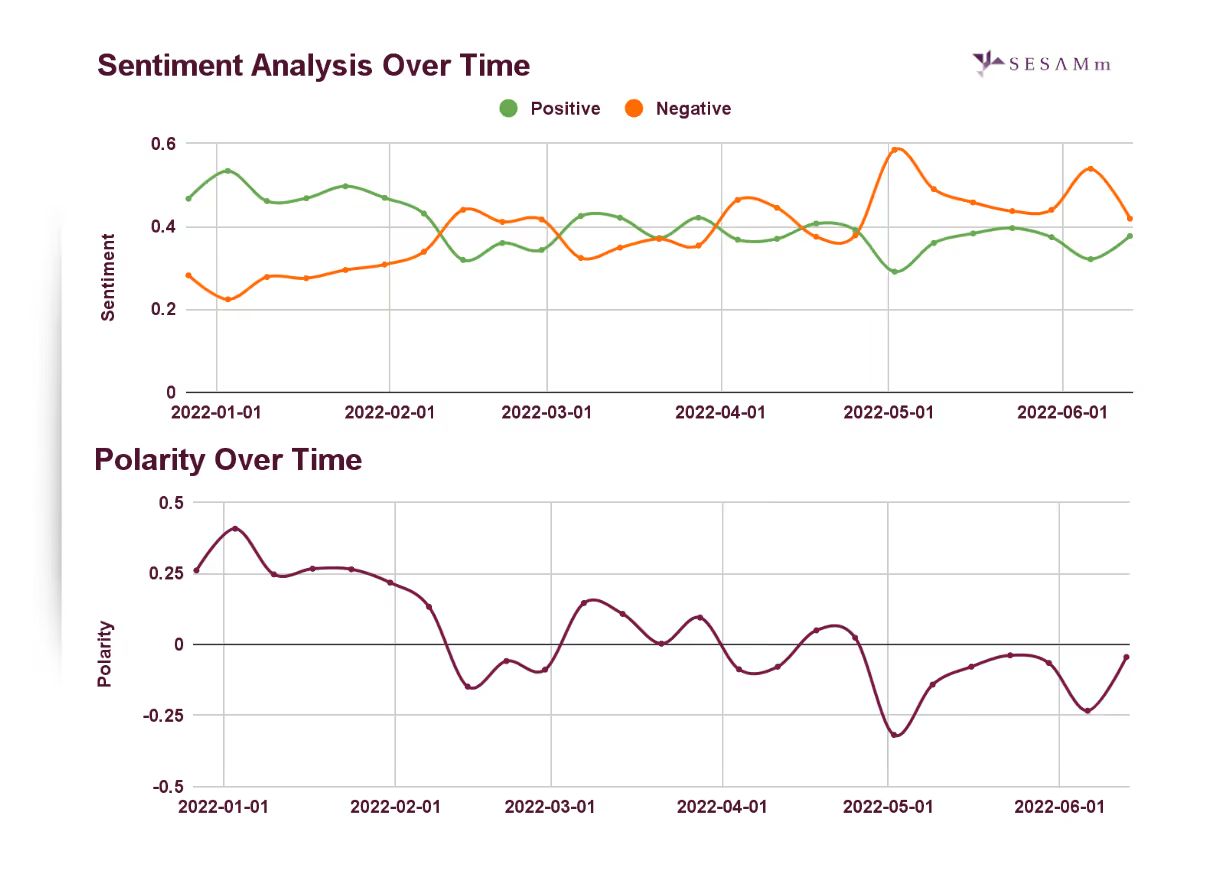
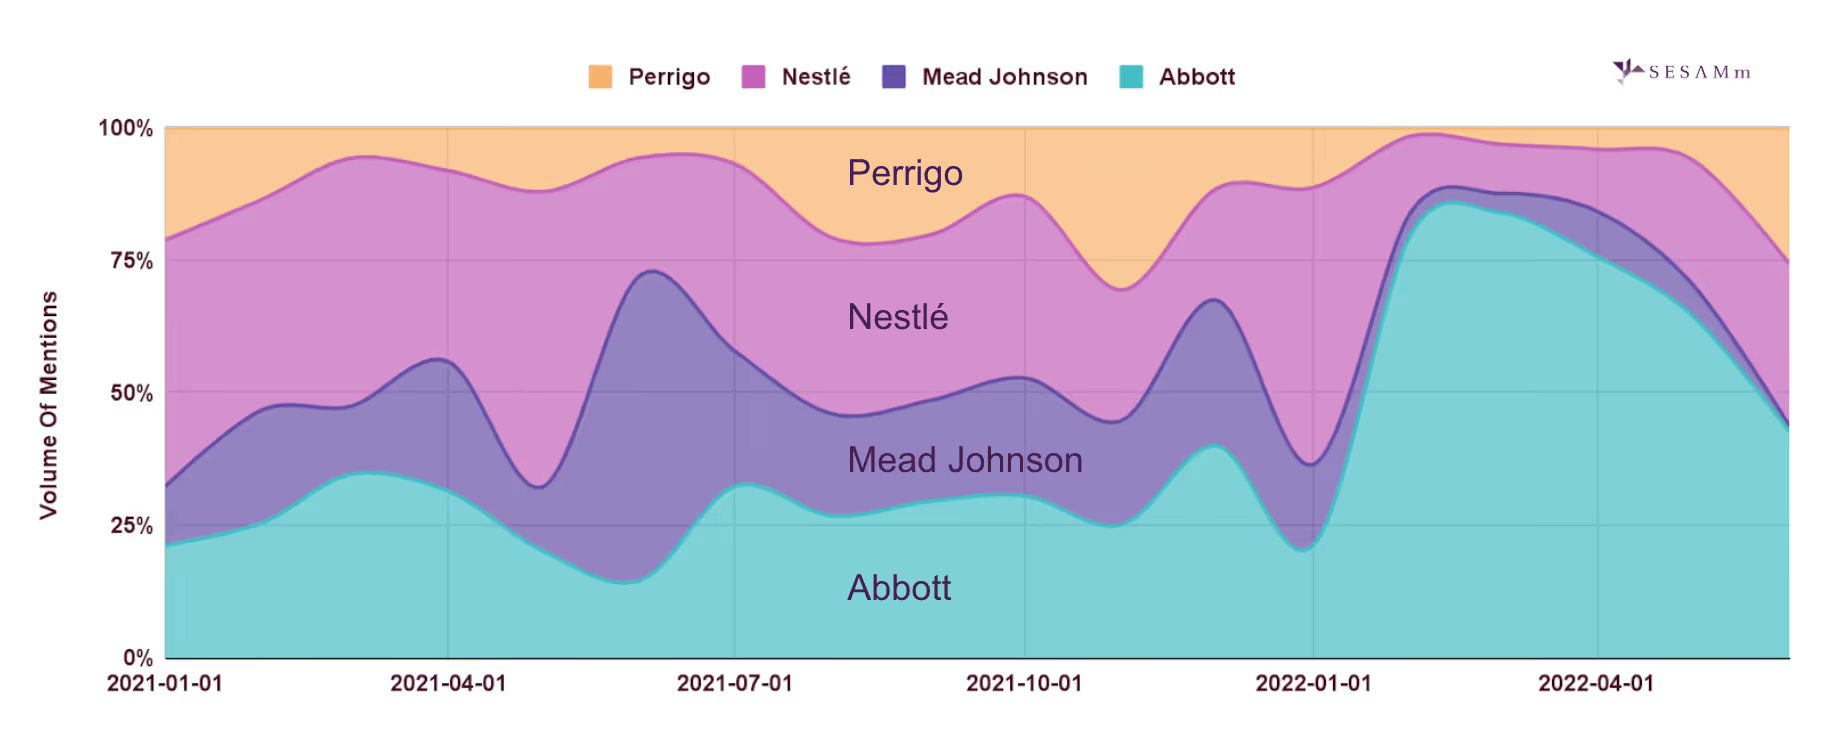
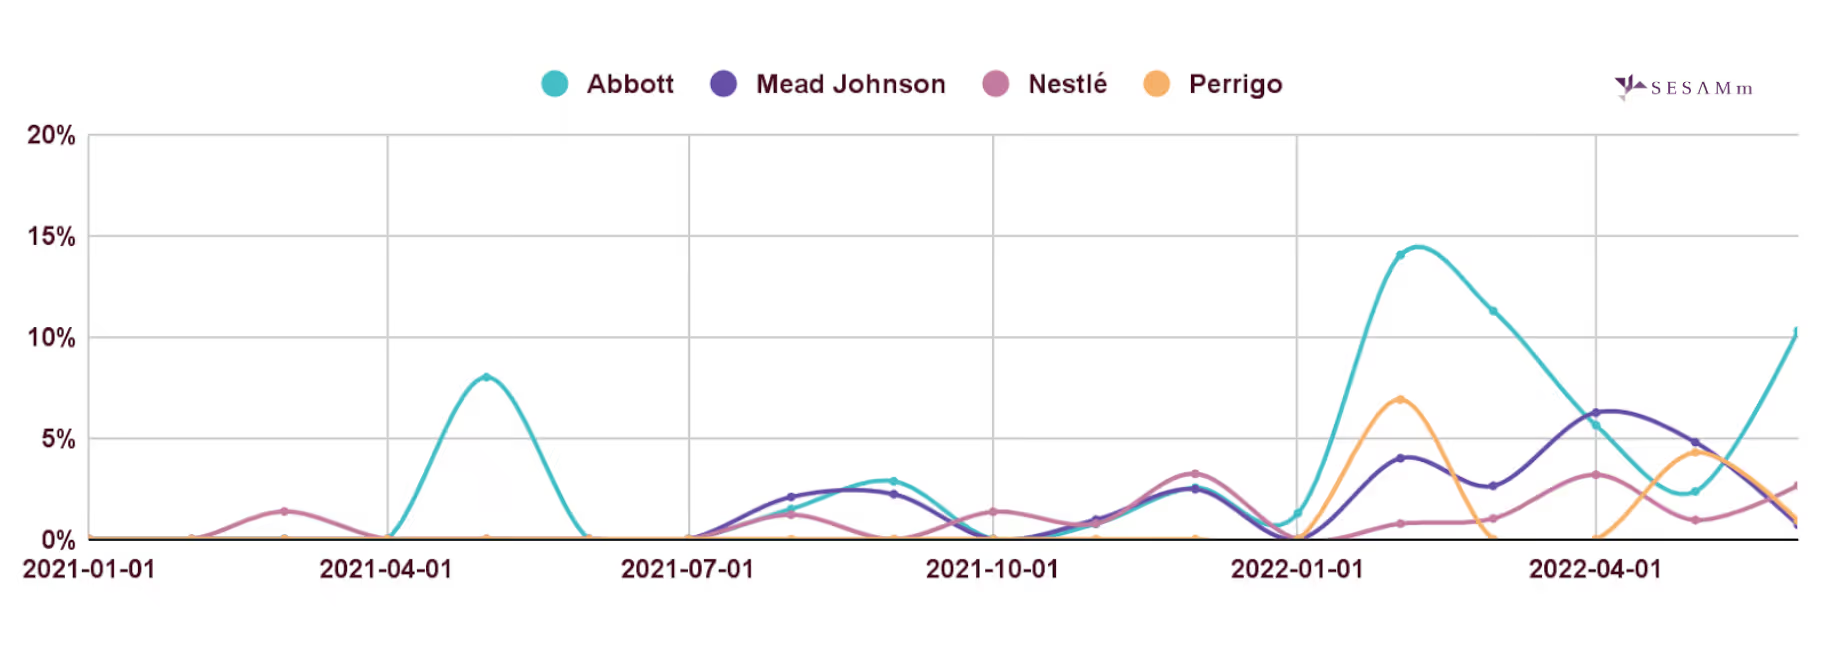


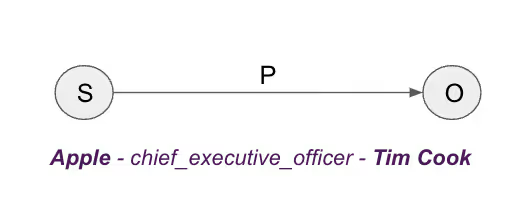
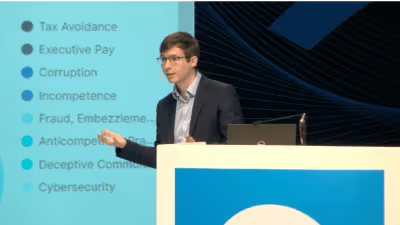
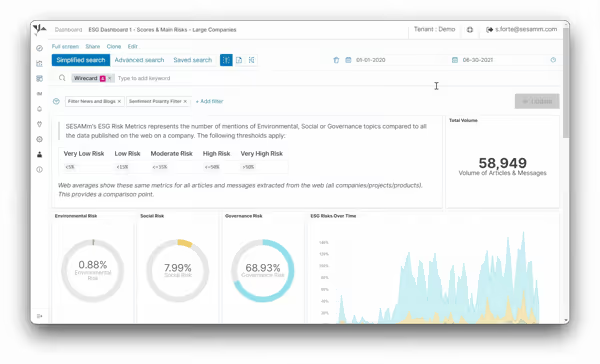
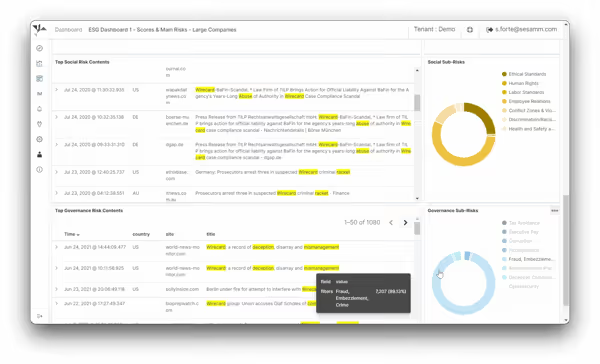
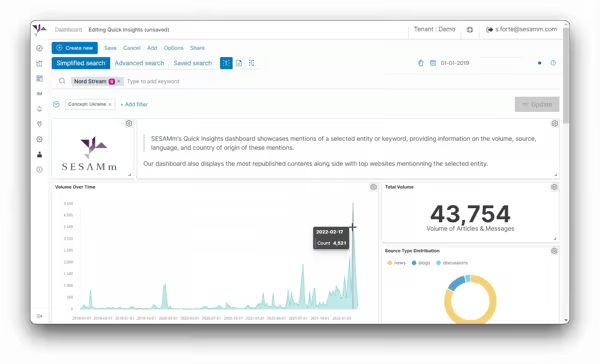
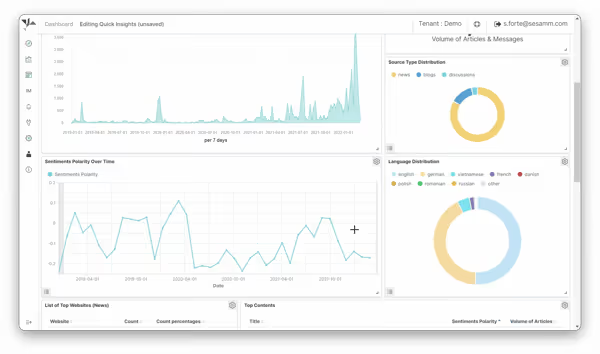
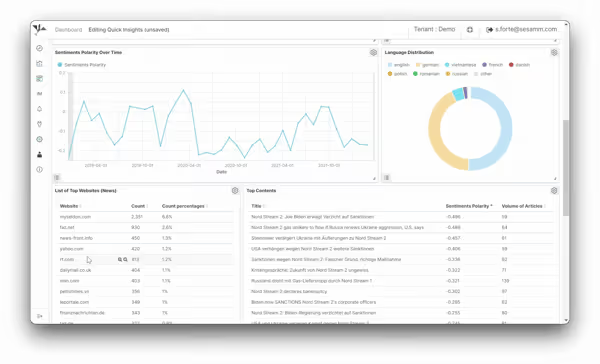

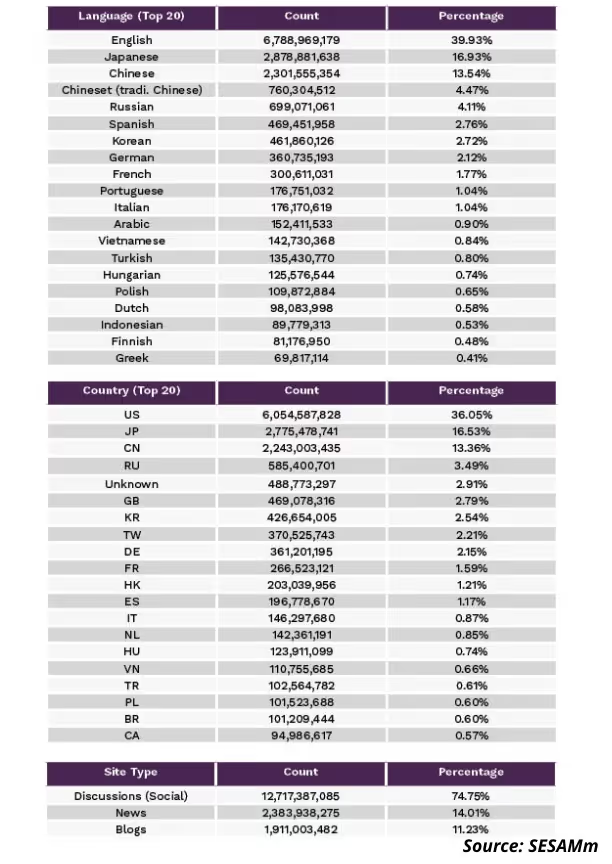
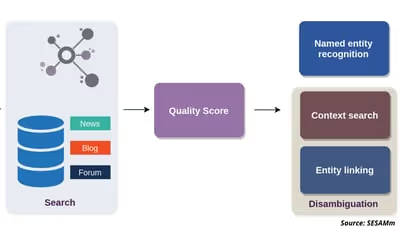
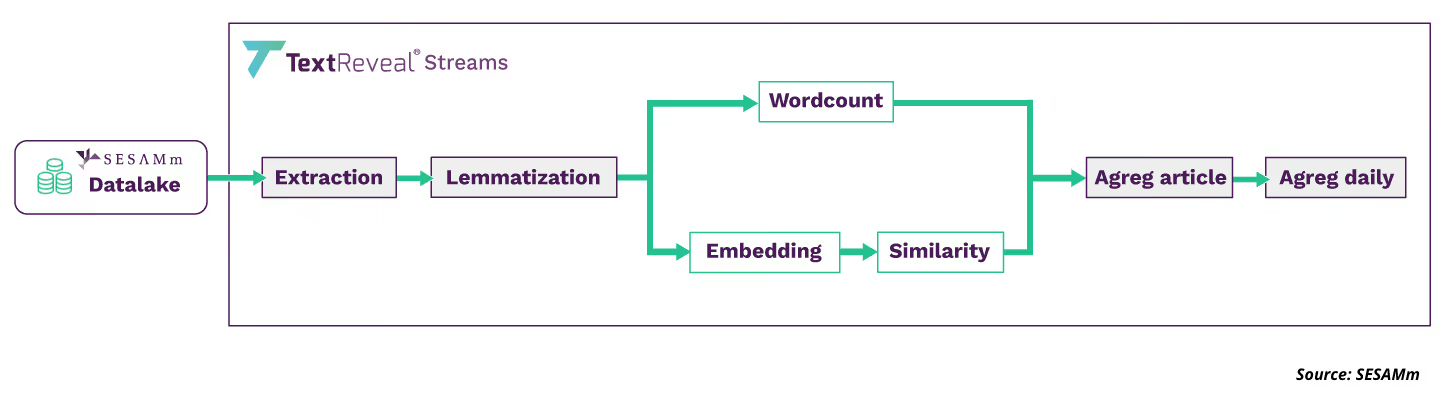
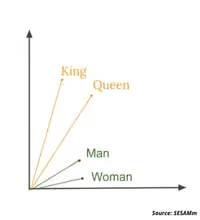
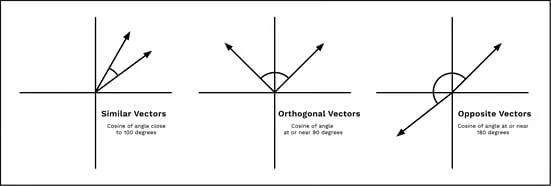
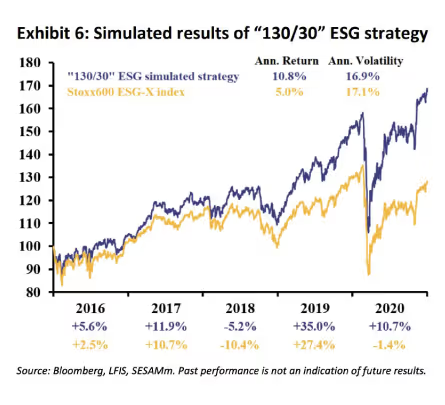
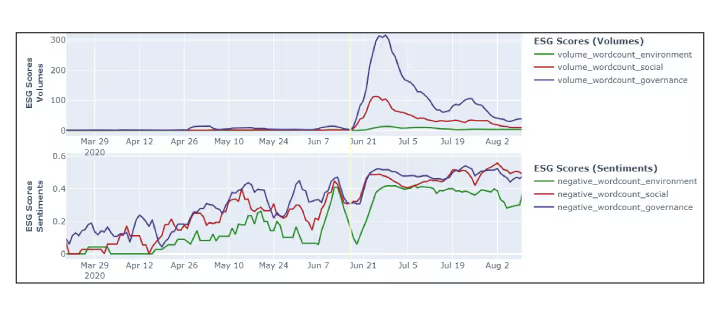

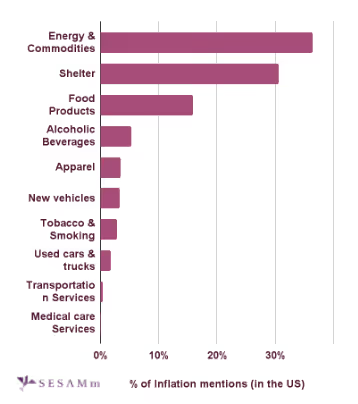
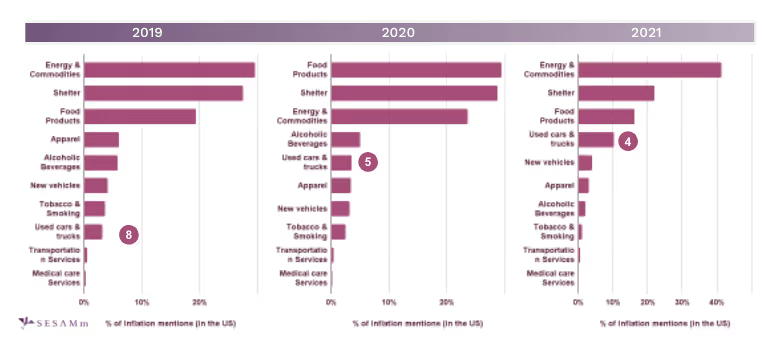
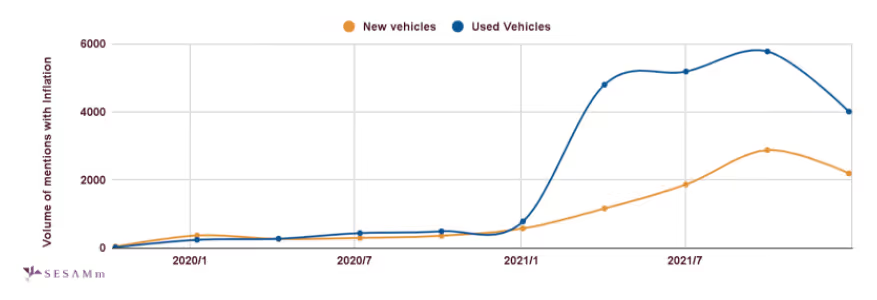
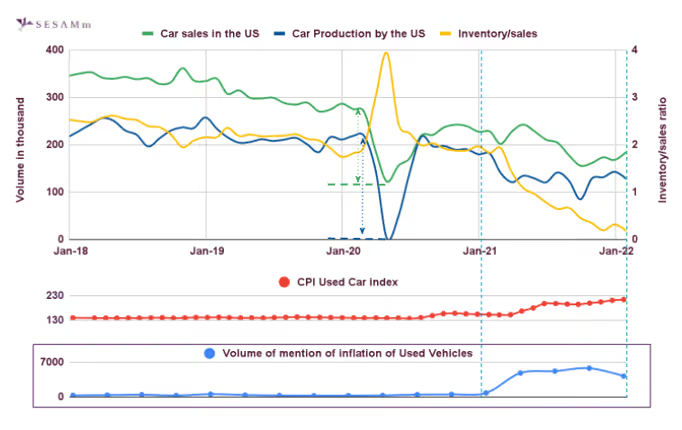

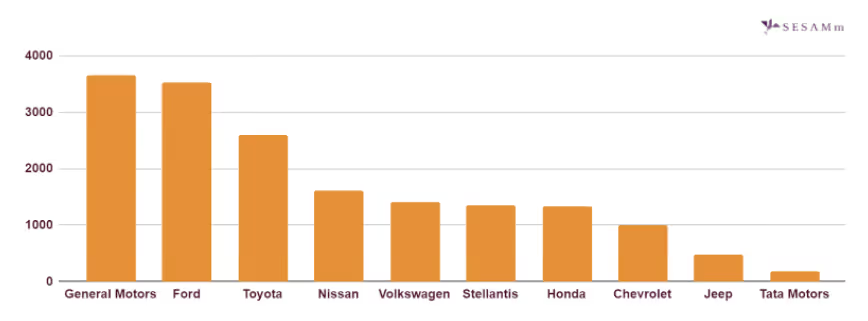


.png)