


Most data companies lead with what their product can do. SESAMm's public methodology does that, and then goes a step further. It defines, in plain terms, exactly what the Controversy Exposure Score measures and where its boundaries lie. That precision, now public and free to access under the EU ESG Rating Regulation that entered into force on 2 July 2026, is what makes the score dependable.
The logic is straightforward. A number is only as useful as the user's understanding of it. SESAMm would rather its clients understand the score completely than take it on trust, because a well-understood score is a score that can be used with confidence.
Built From the Public Record
The CES is built entirely from public and licensed media and web content. That foundation gives it a clear and well-defined scope, and SESAMm is precise about what that scope includes.
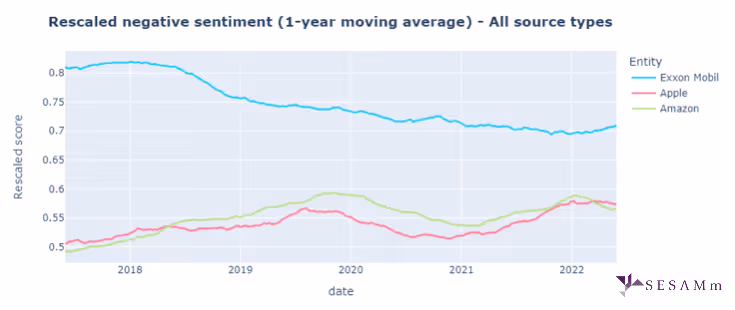
Coverage is richer for some entities than others. Large and high-profile companies generate far more reporting than small or private ones. SESAMm addresses this directly by rebasing each event against an entity's own media history rather than absolute volume, so a company is measured against its own baseline rather than penalised for simply attracting more press. For entities with a persistently low profile, the methodology is explicit that the underlying signal is thinner, which tells a user precisely where to bring additional sources to bear.
Language and source access define the rest of the scope. The pipeline reads a broad and growing set of languages and ingests an extensive range of public and licensed sources. Where a controversy is reported mainly in a language or a publication outside that set, the methodology says so plainly. Defining these edges is what allows a user to place the score accurately within a wider process.
The Discipline of Not Guessing
One principle deserves particular attention, because it sets SESAMm apart from a common industry habit. Where direct coverage of an entity is thin, SESAMm does not fill the gap with proxy data, sector benchmarks or estimated values.
This is a deliberate quality choice. Substituting averages would produce a tidier-looking dataset, but it would manufacture information that does not exist. SESAMm reports only what the evidence supports. For a low-visibility entity, that means a low score reflects the controversies actually detected, and the methodology is clear that this is a measure of detected exposure rather than a clean bill of health. The result is a number a client can stand behind, because nothing in it is invented.
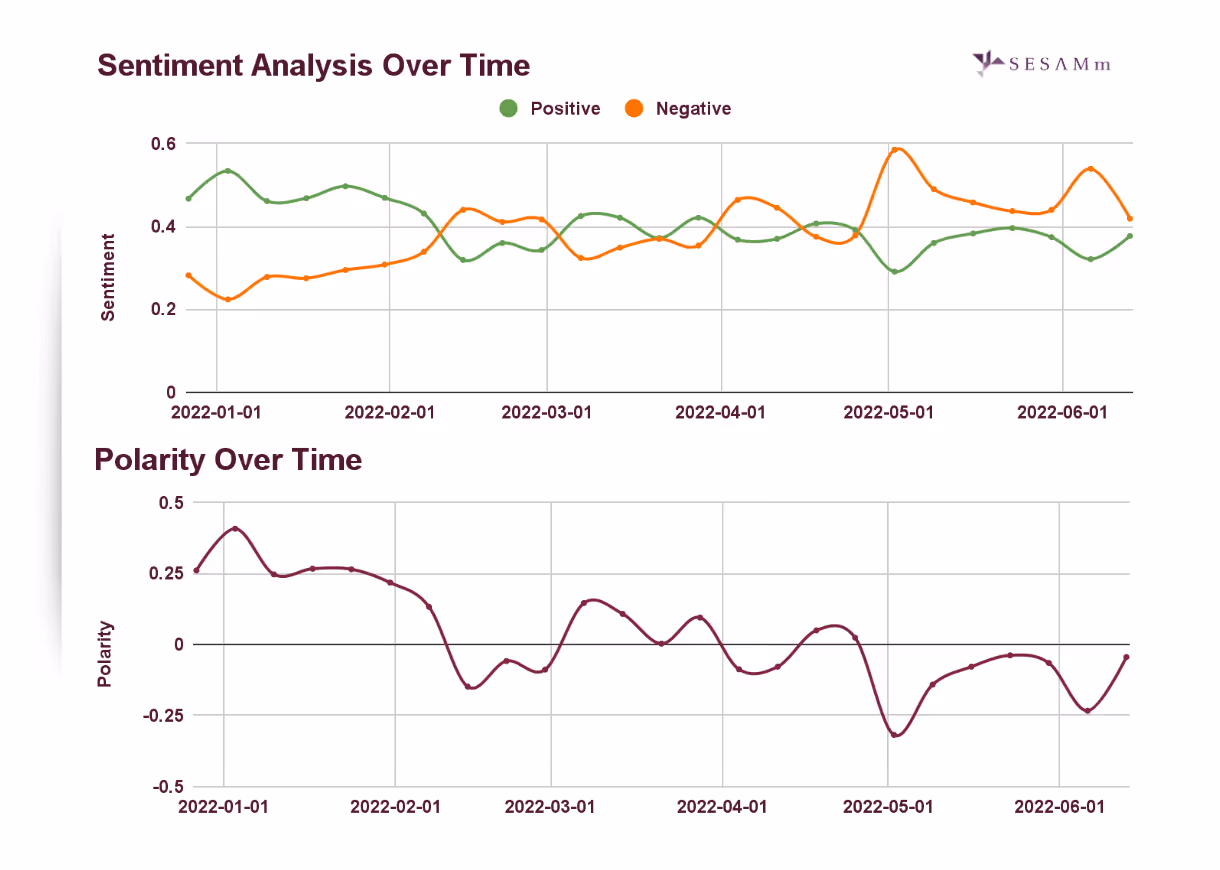
This alo clarifies how the score is best read. The CES measures exposure to negative controversies, which makes it a sharp, single-purpose instrument. It is designed to surface risk, not to certify virtue, and pairing it with positive-performance data is exactly how SESAMm intends it to be used.
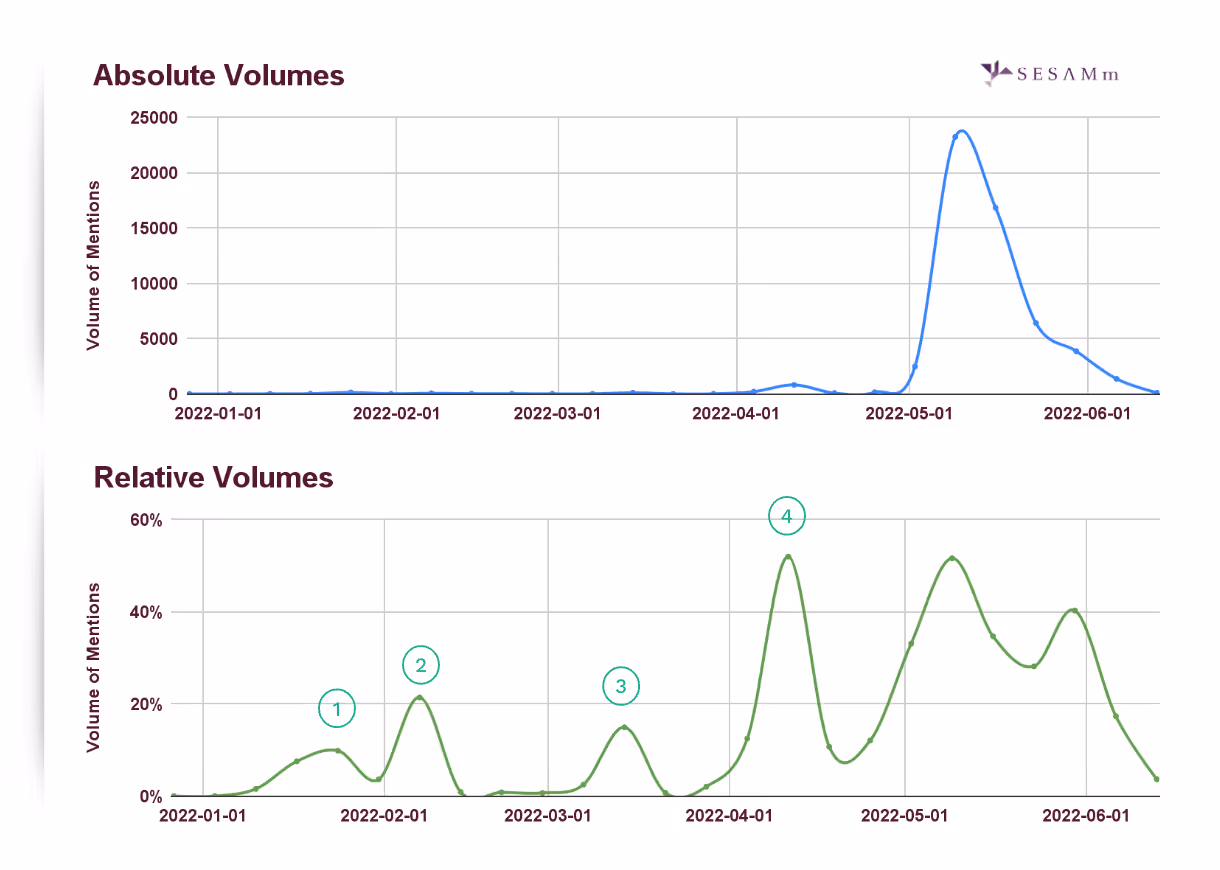
An Early Signal, Drawn From Public Reporting
The CES reflects controversies as reported in public sources, which can include allegations that are still moving through the courts. The methodology is precise about what this means: the score records the existence and salience of reporting, and it is built to give risk teams an early signal rather than a legal conclusion.
This is one of the score's most valuable properties. Reputational and ESG risk very often crystallises long before any legal process concludes. A measure that captures reported exposure as it emerges, while being clear that reporting is not a verdict, gives a risk team time to act early and to weigh the signal appropriately. That combination of timeliness and precision is precisely what makes it useful in practice.
Rigorously Engineered, Openly Documented
Because the score is produced by an AI pipeline, SESAMm documents both how that pipeline works and the controls that keep it accurate. The engineering is the headline here, and it is substantial.
A language-model filter screens for false positives before any event is surfaced. A dual-layer human quality-assurance process, run daily by SESAMm's Research and Analytics team and escalated where needed to the Methodology Lead, reviews accuracy, corrects confirmed issues at the source, and feeds recurring patterns back into the training corpus so the system improves over time. Before any material change to the methodology is deployed, it is backtested against a historical event database, reviewed on the entities it most affects, and signed off by the Methodology Lead. The methodology is formally reviewed at least once a year.
SESAMm also names the structural properties of statistical models openly, because describing a system you understand and control is what gives these safeguards their meaning. The point is not that any model is flawless. It is that the controls are designed for exactly the points where models need them, and that the whole arrangement is documented for anyone to inspect.
Why Defining the Boundaries Builds Trust
There is a quiet truth in ESG data. The providers willing to define the edges of their product are often the ones most worth trusting, because they are describing a system they genuinely understand and operate. A score presented as all-seeing invites misuse. A score presented with its scope clearly marked can be integrated thoughtfully, weighted sensibly, and combined with other inputs exactly as the methodology intends.
SESAMm's view is that this clarity is part of doing AI well, not a step back from it. The same analysts who design the methodology are the ones who test and refine it every day, and the new regulation now gives the whole market a reason to hold itself to the same standard. Precision about what a score means is not a limitation on its value. It is the foundation of it.
To read the full methodology, including how the Controversy Exposure Score is built and the safeguards that keep it accurate, visit sesamm.com/methodology.


.png)